8:00 - 17:00
Opening Hour: Mon - Fri
Click here for rankings table and click here to view interactive maps
Summer is on the horizon with its warm sun, blue skies, and open road beckoning you.
Road trips are as big a part of summer in the U.S. as 4th of July fireworks.
Willie Nelson even wrote a whole song about it:
“On the road again. I just can’t wait to get on the road again….Goin’ places that I’ve never been.”
But can you afford it this summer? Maybe. Check out: car insurance for the summer.
With driving costs on the rise, you may be left wondering, “How many miles did I lose towards a road trip this summer?”
Every state in America lost millions of road trip miles in just one year thanks to gas price inflation.
Scroll down to see exactly how much gas prices have changed since last summer in the U.S. and as a result, how many miles each driver has lost.
Table of Contents
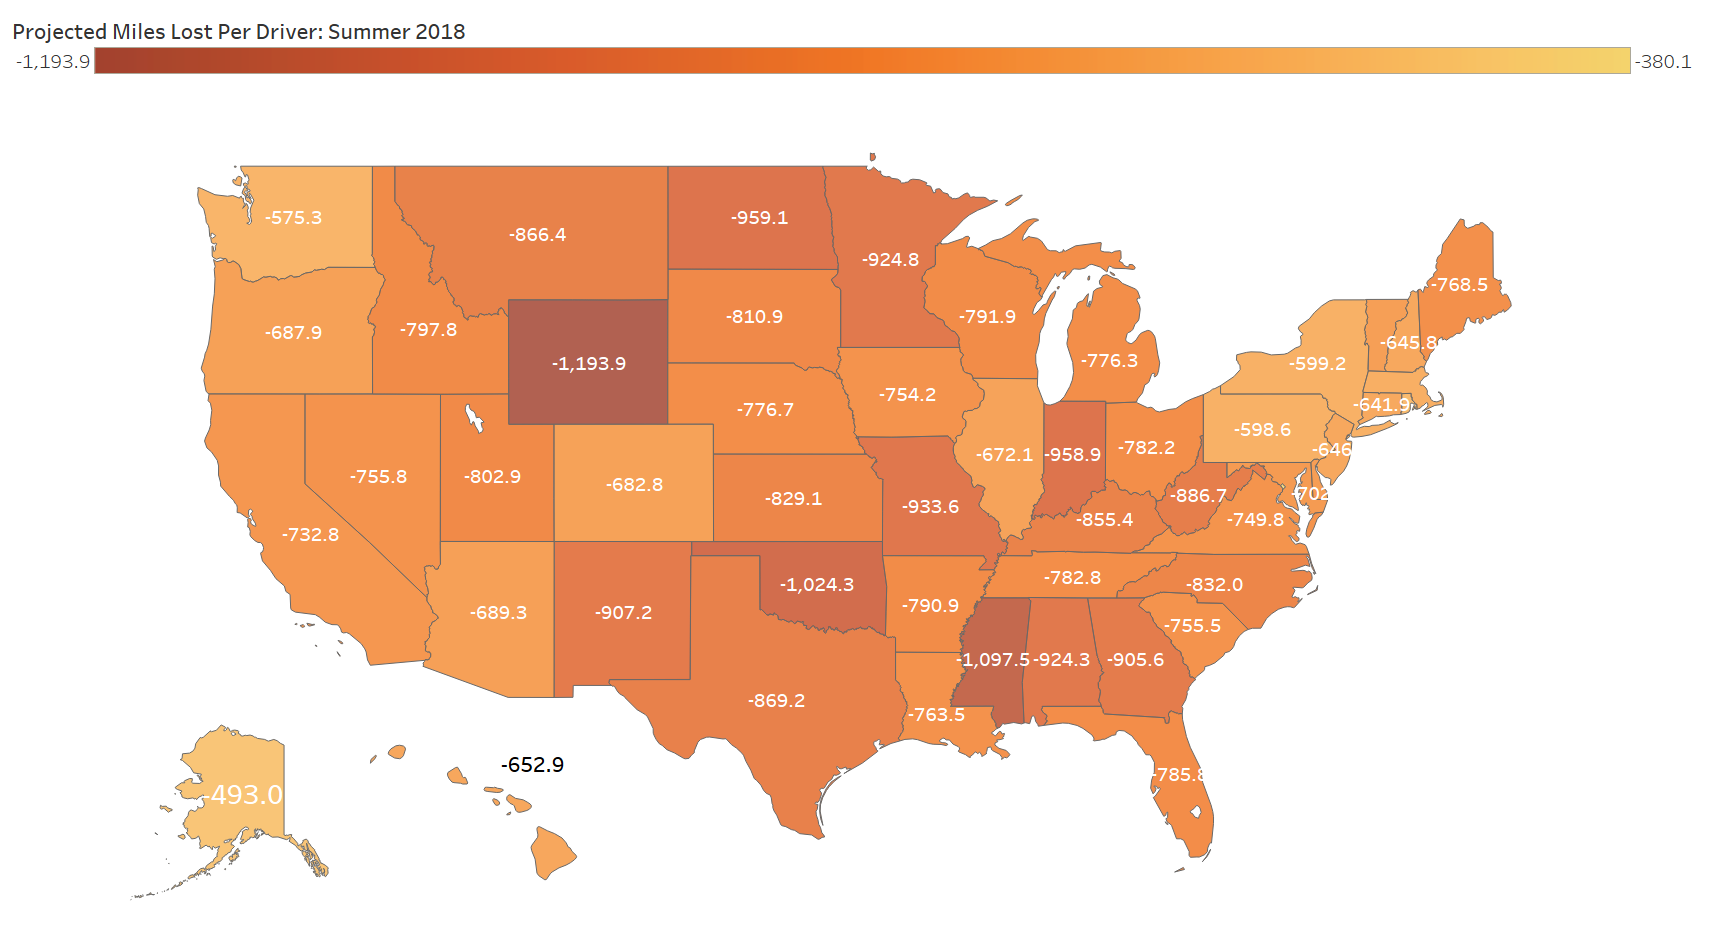
Below is a ranking of all 50 states in America (plus D.C.) according to how many miles each driver lost from 2017 to 2018 based on spikes in gas prices. Read our full methodology here.
Average Summer Miles per Driver: 3,095
Cost of Gas Summer 2017: $2.54
Projected Cost of Gas 2018: $2.89
Summer Miles Lost per Driver: 380.07
If those from the U.S. capital wanted to migrate south for the summer, the Queen City, Charlotte, NC is only 400 miles away, but that trip may not be feasible this summer since each D.C. driver is losing nearly half that round trip in miles.
In D.C., there are 489,831 licensed drivers — 71.91 percent of its population — over 186 million total miles are lost in just one season in this little 68 square mile area.
Average Summer Miles per Driver: 4,015
Cost of Gas Summer 2017: $2.90
Projected Cost of Gas 2018: $3.31
Summer Miles Lost per Driver: 493.02
Most of the spots Alaska is famous for are only accessible by plane or boat, which may not be a bad thing in 2018.
With 534,585 licensed drivers in The Last Frontier, the entire state is losing nearly 264 million miles this summer.
Average Summer Miles per Driver: 4,400
Cost of Gas Summer 2017: $2.35
Projected Cost of Gas 2018: $2.68
Summer Miles Lost per Driver: 540.3
To put it in perspective, Virginia Beach is 543 miles from Providence, Rhode Island.
Rhode Islanders are losing the entire one-way distance of a perfect beach destination road trip!
Altogether, the 753,143 licensed drivers in Rhode Island are losing more than 406.9 million miles.
Average Summer Miles per Driver: 4,685
Cost of Gas Summer 2017: $2.83
Projected Cost of Gas 2018: $3.22
Summer Miles Lost per Driver: 575.32
The distance it takes to get to Cali’s quaint seaport town Eureka from Seattle (582 miles) is about the same as each driver in The Evergreen State is losing this summer.
Licensed drivers in Washington state are losing a grand total of over 3.2 billion miles!
Average Summer Miles per Driver: 4,874
Cost of Gas Summer 2017: $2.53
Projected Cost of Gas 2018: $2.88
Summer Miles Lost per Driver: 598.56
Let’s say a Stephen King fanatic from The Keystone State wanted to visit their favorite author’s hometown, Bangor, Maine. Since Bangor is 602 miles from Lancaster (about the same distance each driver is losing), it just might not be in the cards for 2018.
The great state of Pennsylvania with its 8,996,815 licensed drivers is losing 5.39 billion miles this summer alone.
Average Summer Miles per Driver: 4,879
Cost of Gas Summer 2017: $2.46
Projected Cost of Gas 2018: $2.81
Summer Miles Lost per Driver: 599.19
If someone from New York City wanted to check out a new country, only 503 miles by car would get them to Ontario’s famous amusement park, Canada’s Wonderland.
Sadly, New York drivers are each losing nearly 600 miles this summer, the whole Big Apple is losing a shocking 7.2 billion miles!
Average Summer Miles per Driver: 4,994
Cost of Gas Summer 2017: $2.32
Projected Cost of Gas 2018: $2.65
Summer Miles Lost per Driver: 613.35
If a Boston native loved the water but wanted something slower-paced for vacation, Knott’s Island of the Outer Banks, NC would be a great road trip at only 602 miles.
But maybe not this year, since licensed drivers in Massachusetts are losing just under 3.1 billion miles for 2018 summer travel.
Each motorist is losing the one-way to the Outer Banks . . . Netflix anyone?
Average Summer Miles per Driver: 5,227
Cost of Gas Summer 2017: $2.50
Projected Cost of Gas 2018: $2.85
Summer Miles Lost per Driver: 641.91
In the summer of 2017, a Connecticut resident (called a “Nutmegger”) had Charleston, West Virginia, as a fun road trip destination at just 629 miles away.
But with 642 miles lost individually, Charleston becomes out of reach. Just about 1.7 billion road trip miles are lost for Connecticut drivers this summer.
Average Summer Miles per Driver: 5,258
Cost of Gas Summer 2017: $2.27
Projected Cost of Gas 2018: $2.58
Summer Miles Lost per Driver: 645.75
If you lived in New Hampshire’s capital and wanted to mix U.S. history with good-ole fun, Williamsburg, Virginia, (642 miles from Concord) is easily within your reach by car.
Each driver in The Granite State lost 646 road trip miles this summer. The loss might not be in the billions like in most states, but New Hampshire still has a significant total loss of over 707 million miles.
Average Summer Miles per Driver: 5,262
Cost of Gas Summer 2017: $2.16
Projected Cost of Gas 2018: $2.46
Summer Miles Lost per Driver: 646.24
When Jerseyites wanted to trade Atlantic City and the Jersey shore for the mountains of Gatlinburg, Tennessee, it was possible with just 680 miles under the tires to get there. But, it’s no longer an affordable trip considering it is 34 miles further than the amount each driver is losing this summer.
Nearly 4.1 billion miles of road trip potential is what New Jersey drivers have to say goodbye to in the summer of 2018.
Average Summer Miles per Driver: 5,317
Cost of Gas Summer 2017: $3.30
Projected Cost of Gas 2018: $3.77
Summer Miles Lost per Driver: 652.93
At a speed of 60 mph, (the highest speed limit in Hawaii is 55 mph), it would take just under six hours to circle the gorgeous island of Hawaii. Road trippers could have nearly circled the entire island twice with the number of miles each driver in The Aloha State is losing this summer.
Hawaii has the most expensive gas prices in the entire U.S. to thank for the 608,336,842 summer travel miles lost.
Average Summer Miles per Driver: 5,472
Cost of Gas Summer 2017: $2.29
Projected Cost of Gas 2018: $2.61
Summer Miles Lost per Driver: 672.05
Since Illinois had the greatest percent decrease in gas prices in America from 2016 to 2017, a 4.25 percent drop, state residents are in for a rude awakening for the summer of 2018.
Due to a projected 14 percent increase in gas prices from 2017-2018, each Illinoisan driver is losing a devastating 672 road trip miles, bringing the total to over 5.7 billion miles lost in summer travel this year.
Average Summer Miles per Driver: 5,560
Cost of Gas Summer 2017: $2.67
Projected Cost of Gas 2018: $3.04
Summer Miles Lost per Driver: 682.81
For those looking to ditch Denver, the cowboy town of Oklahoma City is no longer an affordable option.
Each driver from Colorful Colorado is losing 683 miles (more than the distance from Denver to Oklahoma City), and the state as a whole has to part with nearly 2.8 billion miles.
Average Summer Miles per Driver: 5,602
Cost of Gas Summer 2017: $2.68
Projected Cost of Gas 2018: $3.06
Summer Miles Lost per Driver: 687.91
Say you lived in Bend, Oregon, and wanted to visit Jackson Hole, Wyoming, this summer, it would have been a relaxing 694 mile road trip.
Only this summer, destinations like Jackson Hole won’t feel just-around-the-bend considering each Oregonian driver is losing 688 miles and the state as a whole is losing over 1.9 billion summer travel miles!
Average Summer Miles per Driver: 5,613
Cost of Gas Summer 2017: $2.37
Projected Cost of Gas 2018: $2.71
Summer Miles Lost per Driver: 689.30
An enticing road trip destination for someone living in the Arizona deserts would be a place the Beach Boys sang about in Surfin’ USA — California’s famous beaches.
However, Arizona drivers are each losing nearly the number of miles it takes to go from Phoenix to San Diego and back.
The 5,082,305 licensed drivers in Arizona are losing a grand total of over 3.5 billion priceless road trip miles.
Average Summer Miles per Driver: 5,645
Cost of Gas Summer 2017: $2.34
Projected Cost of Gas 2018: $2.67
Summer Miles Lost per Driver: 693.22
Just to put in perspective how many miles Vermont drivers are losing this summer, it’s more than enough to get from Newport to Cape Charles, Virginia.
And that’s just the per driver amount. The Green Mountain State as a whole is losing nearly 384 million miles of travel in 2018’s summer months alone.
Average Summer Miles per Driver: 5,724
Cost of Gas Summer 2017: $2.25
Projected Cost of Gas 2018: $2.57
Summer Miles Lost per Driver: 702.90
Last summer, Delaware residents could ditch the refined gardens of Wilmington and travel 683 miles to the land of bourbon and derby — Louisville, Kentucky — for a fun getaway.
But this summer, every single driver in the Small Wonder is left wondering where they can afford to go with a loss greater than the distance to Louisville.
Delaware is losing 531.6 million miles of summer travel this year.
Average Summer Miles per Driver: 5,851
Cost of Gas Summer 2017: $2.32
Projected Cost of Gas 2018: $2.64
Summer Miles Lost per Driver: 718.53
The 2018 travel miles each Maryland driver is losing would have been enough to get a road tripper from the edge of Maryland right across the Georgia-Florida line for some Sunshine State fun-in-the-sun.
Marylanders won’t be too merry when they learn they are losing just about 3.1 billion road trip miles this summer.
Learn more about Maryland auto insurance here: minimum coverage for auto insurance in Maryland.
Average Summer Miles per Driver: 5,967
Cost of Gas Summer 2017: $3.08
Projected Cost of Gas 2018: $3.51
Summer Miles Lost per Driver: 732.79
Out of the entire continental U.S., California has:
It’s a good thing the residents of The Golden State don’t have to travel far to enjoy great vacation spots.
Average Summer Miles per Driver: 6,106
Cost of Gas Summer 2017: $2.13
Projected Cost of Gas 2018: $2.43
Summer Miles Lost per Driver: 749.82
The amount of miles each Virginia driver is losing this summer is exactly the distance from Roanoke to the “City with Soul,” Jackson, Mississippi.
With Virginia’s central location on the east coast, road trip possibilities were practically limitless — until the state as a whole lost nearly 4.5 billion miles of summer travel thanks to the dramatic gas price increases ahead in 2018.
Average Summer Miles per Driver: 6,142
Cost of Gas Summer 2017: $2.26
Projected Cost of Gas 2018: $2.58
Summer Miles Lost per Driver: 754.24
Like Illinois, Iowa was one of the few states to have a decrease in gas prices from 2016 to 2017, which will only make the 32 cents per gallon projected price increase in Iowa this summer sting even more.
Each Iowan driver is losing the amount of miles it takes to get from Iowa to Lake Michigan and back — with about 300 miles to spare!
Just under 1.7 billion miles are being robbed from Iowa’s vacation-ready residents in the 2018 summer months alone.
Average Summer Miles per Driver: 6,152
Cost of Gas Summer 2017: $2.02
Projected Cost of Gas 2018: $2.31
Summer Miles Lost per Driver: 755.54
Each South Carolina driver could go from Charleston to New Orleans with the miles they are losing in the 2018 summer months. Just 668 miles by car will get you from the southern Carolina to Bourbon Street.
Alas in total, licensed drivers of The Palmetto State are losing upwards of 2.8 billion road trip miles this summer.
Average Summer Miles per Driver: 6,155
Cost of Gas Summer 2017: $2.81
Projected Cost of Gas 2018: $3.20
Summer Miles Lost per Driver: 755.84
Nevada may have had the highest gas price increase in the continental U.S. from 2016 to 2017, 12.29 percent, but it is about to experience an even higher increase this year!
2018’s disappointing 31 cents per gallon increase in Nevada causes drivers to lose the number of miles that would have gotten them from Vegas across the border into Mexico with 279 miles leftover to explore the country!
Nevadians are taking a major hit this year with nearly 1.5 billion summer travel miles lost.
Average Summer Miles per Driver: 6,217
Cost of Gas Summer 2017: $2.12
Projected Cost of Gas 2018: $2.42
Summer Miles Lost per Driver: 763.46
Just 640 miles from New Orleans is a top five most popular vacation destination in the U.S., the home to Universal Studios, Walt Disney World, and SeaWorld . . . Orlando, Florida.
This summer each Louisiana driver is losing 123 miles more than the distance to Orlando, almost 2.6 billion miles in all. Sorry kids.
Average Summer Miles per Driver: 6,258
Cost of Gas Summer 2017: $2.32
Projected Cost of Gas 2018: $2.64
Summer Miles Lost per Driver: 768.47
For those Maine wine lovers, just 650 miles by car from Portland is the heart of Virginia’s Wine Country.
Unfortunately, a road trip to the best vineyards on the East Coast seems out of the question for Maine residents this year.
Each licensed driver in The Pine Tree State is losing 118 more miles than the entire distance from Portland to Charlottesville, Virginia, bringing Maine’s total loss to 785 million miles.
Average Summer Miles per Driver: 6,321
Cost of Gas Summer 2017: $2.41
Projected Cost of Gas 2018: $2.75
Summer Miles Lost per Driver: 776.29
A Michigan resident would only need to drive 650 miles for barbecue and blues in Memphis, Tennessee. That would have been the perfect summer road trip had it not been for each driving-age Michigander losing 776 precious travel miles.
The Wolverine State is getting hit pretty hard this year with a total loss of nearly 5.5 billion road trip miles.
Average Summer Miles per Driver: 6,324
Cost of Gas Summer 2017: $2.27
Projected Cost of Gas 2018: $2.59
Summer Miles Lost per Driver: 776.67
Nebraska residents are able to drive to see the Alamo in under two short days on the road with some nice stops in-between — clocking in at just over 800 miles away.
Seeing this “historic destination for the entire family” seems out of the question for Nebraskans this summer with upwards of 776 road trip miles lost per licensed driver and 1.09 billion miles lost statewide.
Average Summer Miles per Driver: 6,369
Cost of Gas Summer 2017: $2.25
Projected Cost of Gas 2018: $2.57
Summer Miles Lost per Driver: 782.17
From 2016 to 2017 the gas prices in Ohio were reduced by 2.81 percent per gallon, which worked out to be an average decrease of seven cents for every gallon.
After experiencing a pleasant decrease in gas prices in 2017, Ohio residents are not going to like the estimated $0.32 increase per gallon that’s coming their way during the summer of 2018.
With nearly 800 road trip miles lost per driver and over 6.2 billion miles lost to The Buckeye State as a whole, Ohio residents will be limited on their summer vacation options this year.
Average Summer Miles per Driver: 6,374
Cost of Gas Summer 2017: $2.08
Projected Cost of Gas 2018: $2.37
Summer Miles Lost per Driver: 782.82
A motorist can drive from Chattanooga all the way to Dallas, Texas with the number of miles each driver is losing in Tennessee this summer.
Fortunately, there’s a lot of fun to be had within the state because the 5.2 million licensed drivers who live there won’t be able to drive very far with the 4,069,045,146 total miles they are losing in these upcoming summer months.
Average Summer Miles per Driver: 6,399
Cost of Gas Summer 2017: $2.27
Projected Cost of Gas 2018: $2.59
Summer Miles Lost per Driver: 785.81
For Florida residents who enjoy summer-like weather and beaches year-round, exploring the Great Plains would be the perfect road trip and change of scenery. 781 miles on the road can get you from the northwest portion of Florida all the way to Tulsa, Oklahoma.
But with 786 miles lost to each driver and the state as a whole losing an alarming 11.5 billion miles, Floridians may need to stay close to home this summer.
Average Summer Miles per Driver: 6,440
Cost of Gas Summer 2017: $2.08
Projected Cost of Gas 2018: $2.37
Summer Miles Lost per Driver: 790.93
To put the loss in perspective for you, the number of miles each Arkansan driver is losing this summer can get you across the Arkansas border clear to the gorgeous Pecan Island of Louisiana and back (that’s just 582 miles total) with a handy 209 miles to spare!
The nearly 800 miles each driver is losing takes the endless summer road trip possibilities out the window with them.
Statewide, Arkansas is losing just under 1.9 billion road trip miles in the summer months of 2018 alone.
Average Summer Miles per Driver: 6,448
Cost of Gas Summer 2017: $2.32
Projected Cost of Gas 2018: $2.64
Summer Miles Lost per Driver: 791.86
For a Wisconsinite, just 755 miles of open road is between them and their summer getaway in the Poconos Mountains.
But, with Wisconsin drivers each losing 37 more miles than that trip and 3.3 billion miles altogether, such road trips may be far too costly.
Average Summer Miles per Driver: 6,497
Cost of Gas Summer 2017: $2.55
Projected Cost of Gas 2018: $2.91
Summer Miles Lost per Driver: 797.84
It’s hard to find a better road trip than one that involves seeing the “sight beyond words,” the Grand Canyon, and for those living in Idaho, just 697 miles can get you there!
The sad news is that each Idaho driver is losing over 100 miles more than the distance to this “matchless natural wonder.”
Idaho is losing over 926 million miles this summer that they could have used for spectacular road trips.
Average Summer Miles per Driver: 6,538
Cost of Gas Summer 2017: $2.56
Projected Cost of Gas 2018: $2.91
Summer Miles Lost per Driver: 802.87
The West Coast is a tempting road trip destination for many Americans, and just 454 miles can get you from Utah to a beach that’s consistently rated top ten in the nation, Coronado State Beach.
It’s too bad every driver in Utah is losing nearly double the distance to San Diego during 2018’s warmest months. The Beehive State in total is losing just under 1.6 billion road trip miles this travel season.
Average Summer Miles per Driver: 6,603
Cost of Gas Summer 2017: $2.32
Projected Cost of Gas 2018: $2.64
Summer Miles Lost per Driver: 810.88
Doesn’t a road trip to go explore Castle Danger, Minnesota sound cool? From South Dakota’s capital, Pierre, it’s only 542 miles to this mysterious place.
Castle Danger would be a day trip by car if it wasn’t for the more-than-inconvenient 811 miles each and every driver home to the southern Dakota is losing.
The entire state is suffering a loss of about 505 million miles of priceless summertime adventure in 2018.
Average Summer Miles per Driver: 6,751
Cost of Gas Summer 2017: $2.15
Projected Cost of Gas 2018: $2.45
Summer Miles Lost per Driver: 829.11
Have a little astronaut in the family that would be over-the-moon to see “the finest rocket collection in the world” and ride actual rocket simulators? Well, “Rocket City” (Huntsville, Alabama) is just the place, and it’s just a 790 mile road trip away from Wichita, Kansas.
Each and every driver in Kansas is losing 40 more miles than the distance to this super-cool space museum, and the state as a whole is losing over 1.6 billion road trip miles.
Average Summer Miles per Driver: 6,775
Cost of Gas Summer 2017: $2.17
Projected Cost of Gas 2018: $2.47
Summer Miles Lost per Driver: 832.03
Those from the beautiful mountain town of Asheville, North Carolina, just need to drive 788 miles to get to Miami, a vacation spot that boasts of having:
“…multiple enticements for everyone…caffeinated energy…plush hotels…historic hideaways…endless shopping opportunities…and so much more,” according to Visit Florida.
Regrettably, road trips to Florida are going to be tough with each driver in North Carolina being short 832 miles this summer and the state as a whole losing 6,046,428,070 miles.
Average Summer Miles per Driver: 6,966
Cost of Gas Summer 2017: $2.21
Projected Cost of Gas 2018: $2.52
Summer Miles Lost per Driver: 855.44
An easy 693 miles by car allows you to trade world famous horse races, (Louisville, Kentucky) for one of “America’s Favorite Towns” (New Hope, Pennsylvania).
Kentucky residents should lose hope of ever getting to New Hope — at least this summer — with over 855 miles lost per driver and a total of 2.6 billion miles lost for the state.
Average Summer Miles per Driver: 7,055
Cost of Gas Summer 2017: $2.37
Projected Cost of Gas 2018: $2.70
Summer Miles Lost per Driver: 866.41
Residents looking to ditch Bozeman, Montana, with its museum of jail cells and hanging gallows for some happier times in Sin City, can do just that with only 828 miles on the road.
It’s not the distance that’s the problem, but the crippling costs that make this epic vacation unreachable.
In the summer of 2018, each Montana driver is losing over 866 miles, which means a grand total loss for the state of 690,653,567 miles.
Average Summer Miles per Driver: 7,078
Cost of Gas Summer 2017: $2.14
Projected Cost of Gas 2018: $2.43
Summer Miles Lost per Driver: 869.17
Someone from Austin could visit Florida’s popular Panama City Beach with exploration miles to spare if each Texan driver didn’t lose over 869 miles this summer (Austin to Panama City Beach just takes 806 miles).
TripAdvisor paints a picture that will make Texans jealous, “Panama City Beach, with its trademark white sand and warm Gulf waters, attracts everyone from spring breakers to retirees, singles to families.”
Residents are going to have to hunt down some local fun since as a whole they are losing nearly 13.9 billion miles that would have been bbest-spent summer road-tripping.
Average Summer Miles per Driver: 7,221
Cost of Gas Summer 2017: $2.34
Projected Cost of Gas 2018: $2.67
Summer Miles Lost per Driver: 886.74
Have you tried Maine Lobstah?
A West Virginia resident could have gotten from Charles Town all the way to Portland, Maine and more than halfway home with the number of miles each driver is losing this summer.
It’s a good thing “West Virginia is often considered one of the most scenic states in the nation” because drivers who live there won’t be getting very far with nearly 1.03 billion miles lost in total for the 2018 summer season.
Average Summer Miles per Driver: 7,374
Cost of Gas Summer 2017: $2.16
Projected Cost of Gas 2018: $2.47
Summer Miles Lost per Driver: 905.62
New York’s incredible Niagara Falls is just 916 miles from Atlanta.
If it wasn’t for each driver losing 906 miles, Georgians could have traded their sultry summer of the South for the crisp coolness of the Falls up North with an unforgettable road trip.
Over 6.3 billion miles of endless road trip possibilities are lost forever from the summer months in Georgia.
Average Summer Miles per Driver: 7,387
Cost of Gas Summer 2017: $2.25
Projected Cost of Gas 2018: $2.57
Summer Miles Lost per Driver: 907.21
937 miles away from Santa Fe, New Mexico is “one of California’s premier surf spots,” Santa Barbara — only 30 miles more than the number of miles each New Mexico driver is losing during the summer months of 2018 alone.
As a whole, the “Land of Enchantment” is losing almost 1.4 billion miles of summer adventures on the road this year.
Average Summer Miles per Driver: 7,526
Cost of Gas Summer 2017: $2.05
Projected Cost of Gas 2018: $2.34
Summer Miles Lost per Driver: 924.26
It’s pretty amazing when a trip in the car can take you to (what feels like) a completely new world.
Under 660 miles by car can get you from Huntsville, Alabama across our great nation to Grand Rapids, Michigan.
What’s unreal is that each and every driver in Alabama is losing 265 more miles than the distance between them and Lake Michigan!
The entire state of Alabama is losing 3,644,414,503 road trip miles in the 93 days of summer alone.
Average Summer Miles per Driver: 7,531
Cost of Gas Summer 2017: $2.27
Projected Cost of Gas 2018: $2.58
Summer Miles Lost per Driver: 924.82
Those looking to escape the city life of Minneapolis to experience the Wild West of Winifred, Montana, could do so with just 905 miles by car.
In the summer of 2017, this trip would have been completely doable, but since each Minnesotan driver is losing 925 miles, it may be too expensive for many this year.
Minnesota residents are going to be about as happy as those bees when they discover their state is losing over 3.1 billion summer travel miles.
Average Summer Miles per Driver: 7,602
Cost of Gas Summer 2017: $2.07
Projected Cost of Gas 2018: $2.36
Summer Miles Lost per Driver: 933.55
A great way for a Missouri resident to spice things up would be to make a mad dash for the border and explore El Paso, Texas.
That road trip (and many others) will have to be put on hold since each driver in Missouri is losing the distance from Kansas City to El Paso this summer.
In total over 3.9 billion miles are lost due to jacked up gas prices in “The Show-Me State.”
Average Summer Miles per Driver: 7,808
Cost of Gas Summer 2017: $2.28
Projected Cost of Gas 2018: $2.60
Summer Miles Lost per Driver: 958.85
Escaping the city life of Indianapolis for the relaxing New England shores of Newport, Rhode Island, would have been a breeze by car (it’s a 912 mile trip) if it wasn’t for the 959 miles that each Indiana driver is losing this summer.
Lamentably, the state of Indiana is losing over 4.3 billion priceless travel miles in total during the 2018 summer months.
Average Summer Miles per Driver: 7,810
Cost of Gas Summer 2017: $2.32
Projected Cost of Gas 2018: $2.65
Summer Miles Lost per Driver: 959.10
A memorable summer vacation for a North Dakotan would be to hit the open road to go see Lake Erie. Toledo, Ohio, is just 886 miles from Fargo, North Dakota.
The 959 miles each driver in North Dakota is losing would have more than covered the entire one-way distance of that trip. The unignorable problem is that North Dakota is losing over 533 million miles this summer.
Average Summer Miles per Driver: 8,341
Cost of Gas Summer 2017: $2.07
Projected Cost of Gas 2018: $2.36
Summer Miles Lost per Driver: 1,024.32
For Oklahomans, the southern charm of Savannah, Georgia, is just a road trip away at 1,031 miles from Tulsa.
However, each driver in Oklahoma has to watch just about that amount, (over 1,024 miles) go dribbling down the proverbial drain this summer.
During the summer of 2018, The Sooner State is losing an overwhelming total of 2,558,944,561 miles.
Average Summer Miles per Driver: 8,937
Cost of Gas Summer 2017: $2.06
Projected Cost of Gas 2018: $2.35
Summer Miles Lost per Driver: 1,097.47
The $0.29 per gallon price increase in Mississippi means a major decrease in travel this year.
To put this catastrophic loss in perspective, the amount of miles each Mississipian driver is losing is enough to get them clear into Canada!
The state’s total loss this summer season is over 2.2 billion miles.
Average Summer Miles per Driver: 9,722
Cost of Gas Summer 2017: $2.29
Projected Cost of Gas 2018: $2.62
Summer Miles Lost per Driver: 1,093.92
Out of this entire countdown, the biggest jump in miles lost is from second to first place. Each driver in Wyoming is losing over 96 more miles than each driver in Mississippi (and a whole lot more than the drivers in all the other states).
In the 2018 summer months alone, each driver in Wyoming is losing nearly the vertical distance of the United States!
When just one person is losing over 1,000 miles to travel by car in 93 short summer days, you know there is a serious problem.
Due to its smaller population of 585,501 residents, the total miles lost for Wyoming are only about 503 million (still no small amount).
The projected 14 percent increase in gas prices for 2018, puts a major hit on road trip possibilities across our nation this summer.
The licensed drivers of the United States are losing a total of just under 168.8 billion miles!
Every state is expected to have a minimum $0.28 per gallon price increase — with some states getting hit with as high as a $0.46 spike in price for each gallon!
All drivers in the U.S. will experience a higher cost to drive and maintain their vehicles in 2018 compared to the last two years.
Before you find all your summer fun money is long gone, rethink how far you can go this year. It might be the perfect summer for a staycation.
Using reports provided by the Insurance Institute for Highway Safety, the U.S. Department of Transportation, and the Federal Highway Administration, our team of researchers collected the following main categories of information for all 50 states plus the District of Columbia:
With the above statistics and many more intricate details totaling nearly 6,000 data points, our analysts were able to determine how many miles each driver and each state as a whole would be losing in the summer months of 2018 compared to previous years.
– To sort the table by category, click on header columns.
–Click here for the full stats and sources for each category. For all media inquiries, please email: Josh Barnes
| STATE | PROJECTED 2018 SUMMER COST PER GALLON | $ CHANGE PER GALLON 2018 | DIFFERENCE IN MILES DRIVEN PER DRIVER | TOTAL MILES LOST FOR STATE'S DRIVERS |
|---|---|---|---|---|
| Alabama | 2.339 | 0.29 | -924.26 | 3,644,414,503.00 |
| Alaska | 3.306 | 0.41 | -493.02 | 263,560,234.00 |
| Arizona | 2.705 | 0.33 | -689.30 | 3,503,255,205.00 |
| Arkansas | 2.366 | 0.29 | -790.93 | 1,891,188,772.00 |
| California | 3.509 | 0.43 | -732.79 | 19,198,607,719.00 |
| Colorado | 3.044 | 0.37 | -682.81 | 2,776,709,240.00 |
| Connecticut | 2.85 | 0.35 | -641.91 | 1,676,043,977.00 |
| Delaware | 2.567 | 0.32 | -702.90 | 531,626,667.00 |
| District of Columbia | 2.891 | 0.36 | -380.07 | 186,168,889.00 |
| Florida | 2.585 | 0.32 | -785.81 | 11,531,834,386.00 |
| Georgia | 2.466 | 0.3 | -905.62 | 6,317,533,567.00 |
| Hawaii | 3.766 | 0.46 | -652.93 | 608,336,842.00 |
| Idaho | 2.907 | 0.36 | -797.84 | 926,233,450.00 |
| Illinois | 2.611 | 0.32 | -672.05 | 5,722,243,743.00 |
| Indiana | 2.6 | 0.32 | -958.85 | 4,365,877,895.00 |
| Iowa | 2.579 | 0.32 | -754.24 | 1,693,754,386.00 |
| Kansas | 2.45 | 0.3 | -829.11 | 1,683,117,661.00 |
| Kentucky | 2.524 | 0.31 | -855.44 | 2,593,212,632.00 |
| Louisiana | 2.422 | 0.3 | -763.46 | 2,592,007,485.00 |
| Maine | 2.644 | 0.32 | -768.47 | 784,864,561.00 |
| Maryland | 2.644 | 0.32 | -718.53 | 3,064,424,795.00 |
| Massachusetts | 2.649 | 0.33 | -613.35 | 3,091,671,579.00 |
| Michigan | 2.751 | 0.34 | -776.29 | 5,492,008,421.00 |
| Minnesota | 2.583 | 0.32 | -924.82 | 3,123,948,538.00 |
| Mississippi | 2.345 | 0.29 | -1,097.47 | 2,215,635,088.00 |
| Missouri | 2.364 | 0.29 | -933.55 | 3,967,184,094.00 |
| Montana | 2.698 | 0.33 | -866.41 | 690,653,567.00 |
| Nebraska | 2.591 | 0.32 | -776.67 | 1,090,814,503.00 |
| Nevada | 3.2 | 0.39 | -755.84 | 1,415,208,421.00 |
| New Hampshire | 2.583 | 0.32 | -645.75 | 707,892,398.00 |
| New Jersey | 2.463 | 0.3 | -646.24 | 4,031,528,421.00 |
| New Mexico | 2.565 | 0.31 | -907.21 | 1,380,573,567.00 |
| New York | 2.807 | 0.34 | -599.19 | 7,158,882,807.00 |
| North Carolina | 2.471 | 0.3 | -832.03 | 6,046,428,070.00 |
| North Dakota | 2.645 | 0.32 | -959.10 | 533,198,596.00 |
| Ohio | 2.565 | 0.32 | -782.17 | 6,237,731,930.00 |
| Oklahoma | 2.359 | 0.29 | -1,024.32 | 2,558,944,561.00 |
| Oregon | 3.058 | 0.38 | -687.91 | 1,964,493,099.00 |
| Pennsylvania | 2.879 | 0.35 | -598.56 | 5,385,169,591.00 |
| Rhode Island | 2.682 | 0.33 | -540.30 | 406,920,234.00 |
| South Carolina | 2.305 | 0.28 | -755.54 | 2,830,783,626.00 |
| South Dakota | 2.643 | 0.32 | -810.88 | 504,903,860.00 |
| Tennessee | 2.367 | 0.29 | -782.82 | 4,069,045,146.00 |
| Texas | 2.434 | 0.3 | -869.17 | 13,802,277,427.00 |
| U.S. total | 2.654 | 0.33 | -761.00 | 168,755,941,053.00 |
| Utah | 2.913 | 0.36 | -802.87 | 1,573,920,936.00 |
| Vermont | 2.671 | 0.33 | -693.22 | 383,812,865.00 |
| Virginia | 2.43 | 0.3 | -749.82 | 4,432,946,901.00 |
| Washington | 3.22 | 0.4 | -575.32 | 3,242,367,251.00 |
| West Virginia | 2.665 | 0.33 | -886.74 | 1,028,042,105.00 |
| Wisconsin | 2.641 | 0.32 | -791.86 | 3,331,181,287.00 |
| Wyoming | 2.615 | 0.32 | -1,193.92 | 502,755,556.00 |
| State | Projected 2018 summer Cost per Gallon | $ Change per Gallon 2018 | Difference in Miles Driven per Driver | Total Miles Lost for State's Drivers |
Features