Things to remember...
- Road safety conditions are different in every U.S. state.
- Rural driving, contrary to what you might think, actually tends to lead to more accident fatalities than urban driving.
- Many factors contribute to road safety conditions across the U.S., including alcohol consumption and distraction while driving.
If you’ve ever taken a cross-country road trip, you’ve probably noticed — in addition to changes in scenery — differences in road conditions, traffic laws, driving behaviors, and vehicle choice when moving from state to state. Perhaps less obvious, though, is that these differences make certain states far more dangerous (or safer) than others when it comes to driving.
To evaluate road safety across the U.S., auto insurance comparison site AutoInsurance.org has analyzed the most recent NHTSA Fatality Analysis Reporting System (FARS) data. Using this data, its researchers computed certain safety indicators for every state. Below is a heat map showing road fatalities per 100,000 by state.
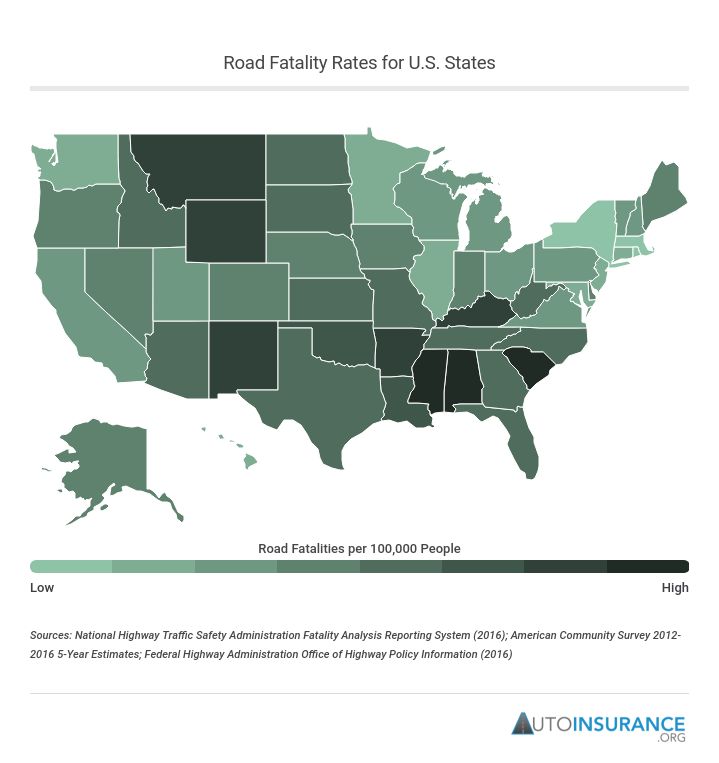
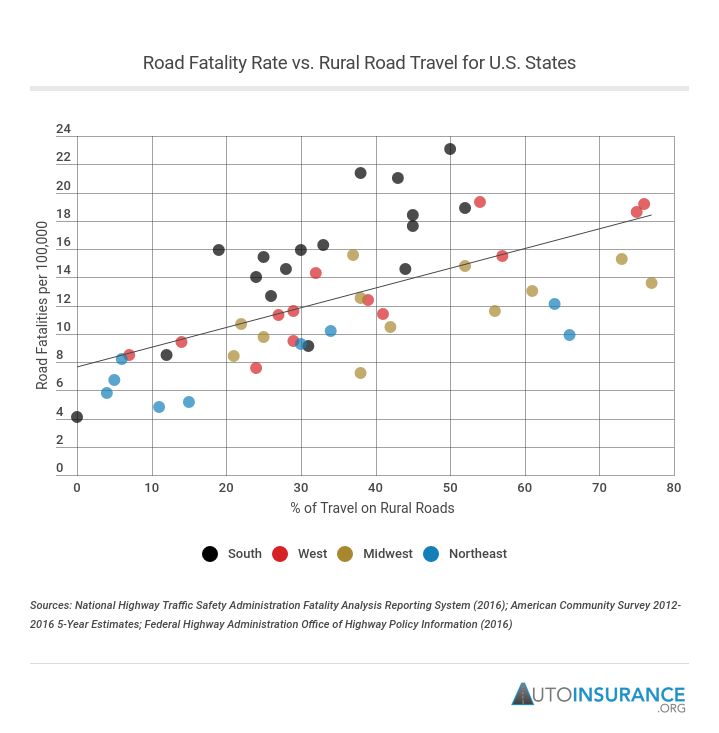
The data highlights one obvious trend: The more rural the state, the more dangerous the roads (generally speaking).
While city driving can be intimidating — with busy intersections, high densities of pedestrians, and difficult parking, among other challenges — urban roads are actually far safer.
In 2016, for example, the total number of deaths that occurred as a result of accidents on rural roads actually exceeded that which occurred on urban roads (18,590 vs. 17,656) despite rural roads being far less traveled.
When adjusting these numbers for traffic volume differences, the disparity is striking. The fatality rate per vehicle mile driven is almost three times higher on rural roads than urban ones, according to AutoInsurance.org research. Not surprisingly, as the percentage of miles driven on rural roads increases (for each state), so does the fatality rate.
So, next time you’re behind the wheel, keep these statistics in mind. While driving in rural areas might seem safer, the data shows otherwise. The list below, ordered from safest to most dangerous, shows how all 50 states and the District of Columbia stack up in terms of road safety.
To review our methodology, click here.
51. District of Columbia
- Road fatalities per 100,000: 4.1
- Total fatal crashes: 26
- % of crashes involving alcohol: 39%
- % of crashes involving a distracted driver: 4%
- % of miles driven on rural roads: 0%
50. Rhode Island
- Road fatalities per 100,000: 4.8
- Total fatal crashes: 48
- % of crashes involving alcohol: 38%
- % of crashes involving a distracted driver: 6%
- % of miles driven on rural roads: 11%
49. New York
- Road fatalities per 100,000: 5.2
- Total fatal crashes: 965
- % of crashes involving alcohol: 17%
- % of crashes involving a distracted driver: 13%
- % of miles driven on rural roads: 16%
48. Massachusetts
- Road fatalities per 100,000: 5.8
- Total fatal crashes: 359
- % of crashes involving alcohol: 29%
- % of crashes involving a distracted driver: 11%
- % of miles driven on rural roads: 4%
47. New Jersey
- Road fatalities per 100,000: 6.7
- Total fatal crashes: 569
- % of crashes involving alcohol: 22%
- % of crashes involving a distracted driver: 33%
- % of miles driven on rural roads: 5%
46. Minnesota
- Road fatalities per 100,000: 7.2
- Total fatal crashes: 357
- % of crashes involving alcohol: 28%
- % of crashes involving a distracted driver: 8%
- % of miles driven on rural roads: 38%
45. Washington
- Road fatalities per 100,000: 7.6
- Total fatal crashes: 504
- % of crashes involving alcohol: 32%
- % of crashes involving a distracted driver: 25%
- % of miles driven on rural roads: 24%
44. Connecticut
- Road fatalities per 100,000: 8.2
- Total fatal crashes: 281
- % of crashes involving alcohol: 30%
- % of crashes involving a distracted driver: 5%
- % of miles driven on rural roads: 6%
43. Illinois
- Road fatalities per 100,000: 8.4
- Total fatal crashes: 1,003
- % of crashes involving alcohol: 26%
- % of crashes involving a distracted driver: 5%
- % of miles driven on rural roads: 21%
42. Hawaii
- Road fatalities per 100,000: 8.5
- Total fatal crashes: 109
- % of crashes involving alcohol: 25%
- % of crashes involving a distracted driver: 17%
- % of miles driven on rural roads: 7%
41. Maryland
- Road fatalities per 100,000: 8.5
- Total fatal crashes: 472
- % of crashes involving alcohol: 24%
- % of crashes involving a distracted driver: 6%
- % of miles driven on rural roads: 12%
40. Virginia
- Road fatalities per 100,000: 9.2
- Total fatal crashes: 722
- % of crashes involving alcohol: 29%
- % of crashes involving a distracted driver: 20%
- % of miles driven on rural roads: 32%
39. Pennsylvania
- Road fatalities per 100,000: 9.3
- Total fatal crashes: 1,088
- % of crashes involving alcohol: 24%
- % of crashes involving a distracted driver: 6%
- % of miles driven on rural roads: 30%
38. California
- Road fatalities per 100,000: 9.4
- Total fatal crashes: 3,357
- % of crashes involving alcohol: 23%
- % of crashes involving a distracted driver: 5%
- % of miles driven on rural roads: 14%
37. Utah
- Road fatalities per 100,000: 9.5
- Total fatal crashes: 259
- % of crashes involving alcohol: 20%
- % of crashes involving a distracted driver: 7%
- % of miles driven on rural roads: 29%
36. Ohio
- Road fatalities per 100,000: 9.8
- Total fatal crashes: 1,053
- % of crashes involving alcohol: 34%
- % of crashes involving a distracted driver: 6%
- % of miles driven on rural roads: 25%
35. Vermont
- Road fatalities per 100,000: 9.9
- Total fatal crashes: 57
- % of crashes involving alcohol: 47%
- % of crashes involving a distracted driver: 5%
- % of miles driven on rural roads: 66%
34. New Hampshire
- Road fatalities per 100,000: 10.2
- Total fatal crashes: 130
- % of crashes involving alcohol: 30%
- % of crashes involving a distracted driver: 4%
- % of miles driven on rural roads: 34%
33. Wisconsin
- Road fatalities per 100,000: 10.6
- Total fatal crashes: 544
- % of crashes involving alcohol: 32%
- % of crashes involving a distracted driver: 18%
- % of miles driven on rural roads: 42%
32. Michigan
- Road fatalities per 100,000: 10.7
- Total fatal crashes: 980
- % of crashes involving alcohol: 25%
- % of crashes involving a distracted driver: 6%
- % of miles driven on rural roads: 22%
31. Colorado
- Road fatalities per 100,000: 11.3
- Total fatal crashes: 558
- % of crashes involving alcohol: 34%
- % of crashes involving a distracted driver: 12%
- % of miles driven on rural roads: 28%
30. Alaska
- Road fatalities per 100,000: 11.4
- Total fatal crashes: 78
- % of crashes involving alcohol: 45%
- % of crashes involving a distracted driver: 1%
- % of miles driven on rural roads: 41%
29. Nebraska
- Road fatalities per 100,000: 11.6
- Total fatal crashes: 194
- % of crashes involving alcohol: 39%
- % of crashes involving a distracted driver: 7%
- % of miles driven on rural roads: 57%
28. Nevada
- Road fatalities per 100,000: 11.6
- Total fatal crashes: 303
- % of crashes involving alcohol: 30%
- % of crashes involving a distracted driver: 3%
- % of miles driven on rural roads: 29%
27. Maine
- Road fatalities per 100,000: 12.1
- Total fatal crashes: 151
- % of crashes involving alcohol: 31%
- % of crashes involving a distracted driver: 2%
- % of miles driven on rural roads: 64%
26. Oregon
- Road fatalities per 100,000: 12.4
- Total fatal crashes: 446
- % of crashes involving alcohol: 27%
- % of crashes involving a distracted driver: 2%
- % of miles driven on rural roads: 39%
25. Indiana
- Road fatalities per 100,000: 12.5
- Total fatal crashes: 768
- % of crashes involving alcohol: 18%
- % of crashes involving a distracted driver: 5%
- % of miles driven on rural roads: 38%
24. Delaware
- Road fatalities per 100,000: 12.7
- Total fatal crashes: 116
- % of crashes involving alcohol: 31%
- % of crashes involving a distracted driver: 14%
- % of miles driven on rural roads: 26%
23. Iowa
- Road fatalities per 100,000: 13.0
- Total fatal crashes: 356
- % of crashes involving alcohol: 26%
- % of crashes involving a distracted driver: 9%
- % of miles driven on rural roads: 61%
22. South Dakota
- Road fatalities per 100,000: 13.6
- Total fatal crashes: 103
- % of crashes involving alcohol: 42%
- % of crashes involving a distracted driver: 9%
- % of miles driven on rural roads: 77%
21. Texas
- Road fatalities per 100,000: 14.0
- Total fatal crashes: 3,407
- % of crashes involving alcohol: 25%
- % of crashes involving a distracted driver: 11%
- % of miles driven on rural roads: 24%
20. Arizona
- Road fatalities per 100,000: 14.3
- Total fatal crashes: 865
- % of crashes involving alcohol: 23%
- % of crashes involving a distracted driver: 6%
- % of miles driven on rural roads: 32%
19. North Carolina
- Road fatalities per 100,000: 14.6
- Total fatal crashes: 1,348
- % of crashes involving alcohol: 28%
- % of crashes involving a distracted driver: 12%
- % of miles driven on rural roads: 28%
18. West Virginia
- Road fatalities per 100,000: 14.6
- Total fatal crashes: 250
- % of crashes involving alcohol: 28%
- % of crashes involving a distracted driver: 2%
- % of miles driven on rural roads: 44%
17. Kansas
- Road fatalities per 100,000: 14.8
- Total fatal crashes: 381
- % of crashes involving alcohol: 21%
- % of crashes involving a distracted driver: 25%
- % of miles driven on rural roads: 52%
16. Georgia
- Road fatalities per 100,000: 15.4
- Total fatal crashes: 1,422
- % of crashes involving alcohol: 22%
- % of crashes involving a distracted driver: 5%
- % of miles driven on rural roads: 25%
15. North Dakota
- Road fatalities per 100,000: 15.4
- Total fatal crashes: 102
- % of crashes involving alcohol: 48%
- % of crashes involving a distracted driver: 11%
- % of miles driven on rural roads: 73%
14. Idaho
- Road fatalities per 100,000: 15.5
- Total fatal crashes: 232
- % of crashes involving alcohol: 28%
- % of crashes involving a distracted driver: 21%
- % of miles driven on rural roads: 57%
13. Missouri
- Road fatalities per 100,000: 15.6
- Total fatal crashes: 868
- % of crashes involving alcohol: 28%
- % of crashes involving a distracted driver: 9%
- % of miles driven on rural roads: 37%
12. Florida
- Road fatalities per 100,000: 15.9
- Total fatal crashes: 2,933
- % of crashes involving alcohol: 21%
- % of crashes involving a distracted driver: 8%
- % of miles driven on rural roads: 19%
11. Tennessee
- Road fatalities per 100,000: 15.9
- Total fatal crashes: 966
- % of crashes involving alcohol: 23%
- % of crashes involving a distracted driver: 13%
- % of miles driven on rural roads: 30%
10. Louisiana
- Road fatalities per 100,000: 16.3
- Total fatal crashes: 704
- % of crashes involving alcohol: 30%
- % of crashes involving a distracted driver: 19%
- % of miles driven on rural roads: 33%
9. Oklahoma
- Road fatalities per 100,000: 17.6
- Total fatal crashes: 624
- % of crashes involving alcohol: 28%
- % of crashes involving a distracted driver: 8%
- % of miles driven on rural roads: 45%
8. Arkansas
- Road fatalities per 100,000: 18.4
- Total fatal crashes: 488
- % of crashes involving alcohol: 23%
- % of crashes involving a distracted driver: 5%
- % of miles driven on rural roads: 45%
7. Montana
- Road fatalities per 100,000: 18.6
- Total fatal crashes: 171
- % of crashes involving alcohol: 48%
- % of crashes involving a distracted driver: 9%
- % of miles driven on rural roads: 75%
6. Kentucky
- Road fatalities per 100,000: 18.9
- Total fatal crashes: 763
- % of crashes involving alcohol: 25%
- % of crashes involving a distracted driver: 25%
- % of miles driven on rural roads: 52%
5. Wyoming
- Road fatalities per 100,000: 19.2
- Total fatal crashes: 100
- % of crashes involving alcohol: 29%
- % of crashes involving a distracted driver: 15%
- % of miles driven on rural roads: 76%
4. New Mexico
- Road fatalities per 100,000: 19.3
- Total fatal crashes: 358
- % of crashes involving alcohol: 29%
- % of crashes involving a distracted driver: 40%
- % of miles driven on rural roads: 54%
3. South Carolina
- Road fatalities per 100,000: 21.0
- Total fatal crashes: 936
- % of crashes involving alcohol: 36%
- % of crashes involving a distracted driver: 5%
- % of miles driven on rural roads: 43%
2. Alabama
- Road fatalities per 100,000: 21.4
- Total fatal crashes: 937
- % of crashes involving alcohol: 15%
- % of crashes involving a distracted driver: 5%
- % of miles driven on rural roads: 38%
1. Mississippi
- Road fatalities per 100,000: 23.1
- Total fatal crashes: 628
- % of crashes involving alcohol: 16%
- % of crashes involving a distracted driver: 0%
- % of miles driven on rural roads: 50%
Methodology
AutoInsurance.org analyzed vehicle accident data from the NHTSA Fatality Analysis Reporting System. The NHTSA FARS data only includes accidents that resulted in a fatality.
State population data was obtained from the American Community Survey 2012 to 2016 5-Year Estimates.
Annual vehicle miles driven by state and road type were obtained from the Federal Highway Administration Office of Highway Policy Information.
All data used is from 2016 — the most recent available.
- Using this data, summary statistics for each state were determined.
- States were then ordered based on road fatalities per 100,000 people.
- The percent of crashes involving alcohol is the percent of fatal crashes in which one or more of the drivers involved had a positive BAC, or if the police reported alcohol involvement in the accident.
- The percentage of crashes involving a distracted driver is the percent of fatal crashes in which one or more of the drivers involved was reported to have been distracted prior to realization of the impending accident, or prior to impact if the realization of the impending accident did not occur.
The NHTSA defines distracted driving as diversion of attention from the driving task to some other activity. Driving while daydreaming or lost in thought is considered distracted driving. Physical conditions/impairments (fatigue, alcohol, medical condition, etc.) or psychological states (anger, emotional, depressed, etc.) are not.
Start comparison shopping today using our FREE online tool. Enter your zip code below to get started!
References:
- https://crashstats.nhtsa.dot.gov/Api/Public/ViewPublication/812451
- https://www.nhtsa.gov/research-data/fatality-analysis-reporting-system-fars
- https://factfinder.census.gov/faces/tableservices/jsf/pages/productview.xhtml?src=bkmk
- https://www.fhwa.dot.gov/policyinformation/
Features
15.03.2018 / car accidents / safest highways by states