8:00 - 17:00
Opening Hour: Mon - Fri
>> View the UPDATED results of this study
Click here to view the interactive graphics and here to view the data tables.
As you drive your car daily, you may not think much about being in an accident. Your possibility of being in a car wreck, however, could be greater than you realize — especially depending on where you live.
Overall, the number of fatal crashes in the U.S. has decreased by 5,269 since we first began our study in 2007. But if you compare 2015 to 2014, there has actually been a recent increase in fatal accidents.
In 2015, there were 32,166 fatal crashes in the U.S. If you compare this to the 29,989 fatal accidents of 2014, you’ll find there were 2,177 more fatal crashes in 2015 than in 2014.
According to the National Highway Traffic Safety Administration (NHTSA), 35,092 people died in motor vehicle crashes in 2015, up 7.2 percent from the 32,744 overall fatalities in 2014.
This 7.2 percent increase in 2015 is the largest percentage increase in nearly 50 years.
Learning more about the recent increase in fatal accidents may cause you to wonder whether there is a common denominator. Experts agree the most common causes of fatal car accidents are speeding, intoxication, and failure to use seat belts.
You should also consider the fact that more people were driving in 2015 than in 2014 due to a stronger economy and cheaper fuel prices.
Last, fatal accidents involving distracted driving are constantly on the rise thanks to advances in technology that allow people to text, take pictures, and FaceTime while behind the wheel.
Here’s what we cover:
Before you hit the road, protect yourself with auto insurance. Simply click here to compare rates and policies for FREE!
Table of Contents
Considering 2015’s alarming record for traffic-related fatalities, you may want to find out how dangerous it is to drive where you live.
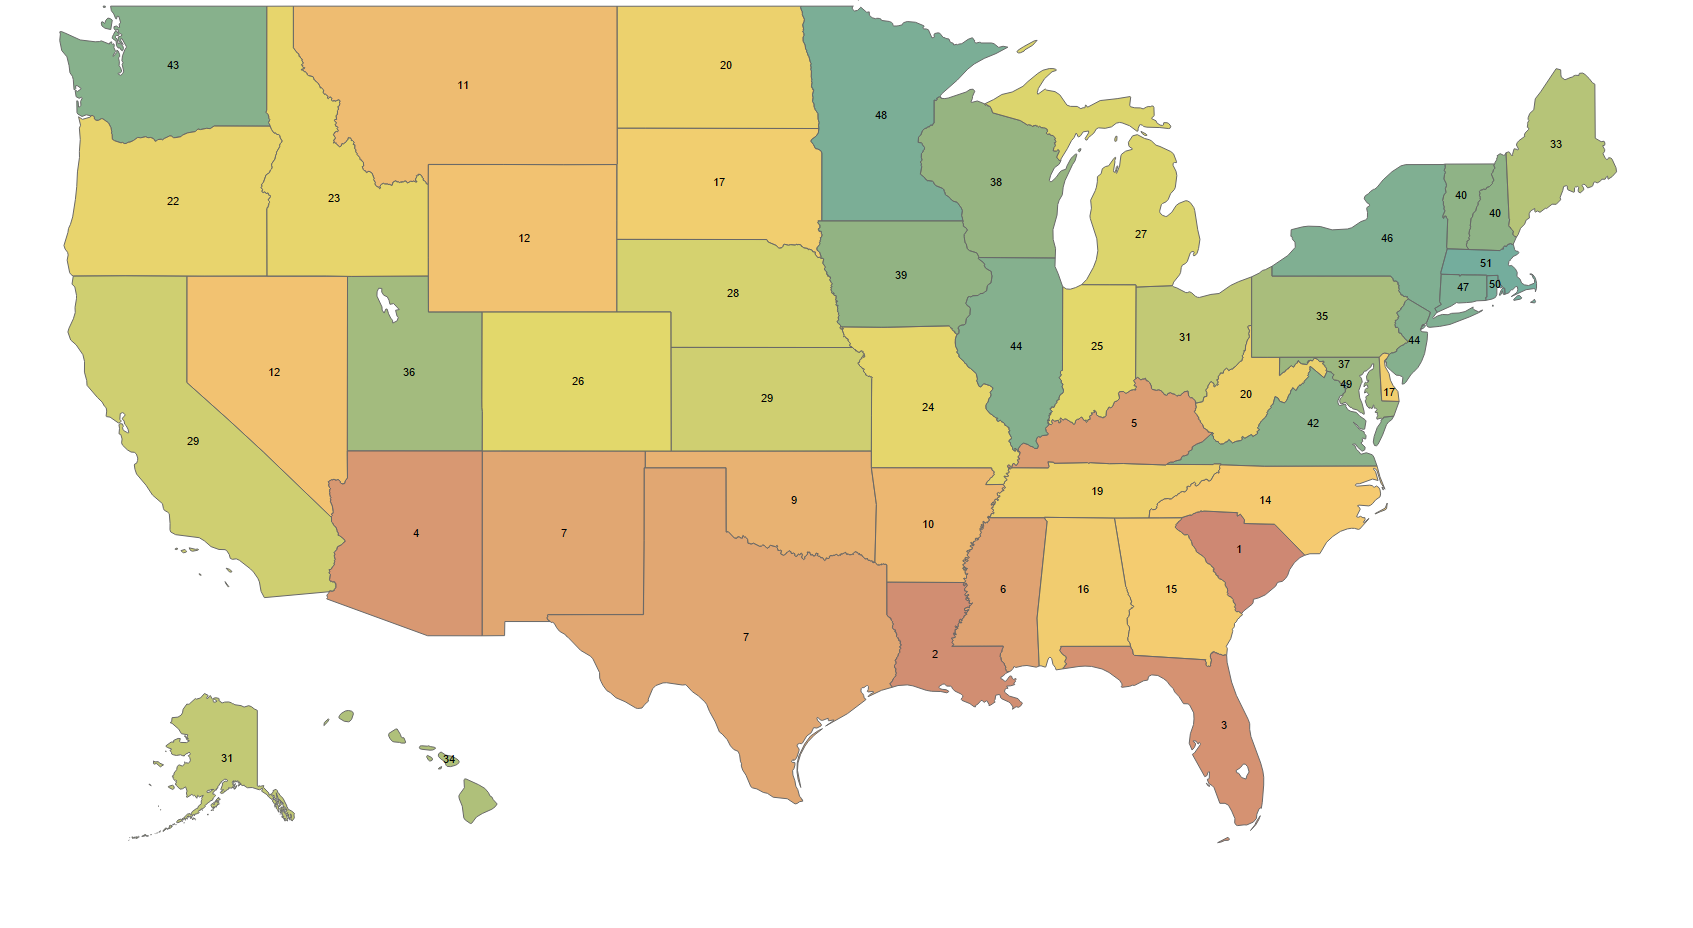
We have ranked all 50 U.S. states, plus the District of Columbia, with regard to traffic-related fatalities to give you a better idea of what you’re up against.
Best Ranking Factor: Total Pedacyclist Fatalities: 42nd
Worst Ranking Factor: Total Fatalities by 100 Million Miles Driven and Total Motorcyclist Fatalities: 5th
In Arkansas in 2015, for every 100 million miles driven, 1.52 lives were taken in a traffic-related accident, and 3.73 motorcyclists were killed in a fatal accident per 100,000 licensed drivers.
Passenger Fatalities weren’t too far behind on the worst factor list at 6th place, and Arkansas drivers ranked 7th for Total Driver Fatalities.
Taking into account that half of Arkansas is covered by forestland and the state population is just over three million as of 2017 (only 6.6 percent of New York’s population), the residents of Arkansas need to get their act together while on the road.
Best Ranking Factor: Total Pedacyclist Fatalities: 33rd
Worst Ranking Factor: Total Motorcyclist Fatalities: 6th
Oklahoma only has around four million residents and is the 20th largest state in the United States, but drivers in Oklahoma seem to not know how to share the road and avoid fatalities.
Per 100,000 residents in Oklahoma, there was a 22.75 traffic-related crash rate in 2015.
Best Ranking Factor: Total Pedacyclist Fatalities: 23rd
Worst Ranking Factor: Total Fatalities by 100 Million Miles Driven: 11th
When it comes to worst ranking factors, Texas had very close rankings in the other four categories:
Though Texas is the second most populous state in the U.S. with almost 28 million residents, the state still had far too many traffic-related fatalities in 2015 (3,516) and has much to improve on to make its roads safer.
Best Ranking Factor: Total Fatalities by 100 Million Miles Driven: 28th
Worst Ranking Factor: Total Pedestrian Fatalities: 1st
Though New Mexico and Texas are technically tied for 7th on our Words States list, New Mexico ranked higher because it was the absolute worst state for pedestrian fatalities.
In 2016, Business Insider ranked the 10 worst states in which to be a pedestrian; New Mexico was #1 on their list with 76 total pedestrian fatalities in 2015.
New Mexico’s higher pedestrian fatality is caused by two major factors: alcohol and jaywalking.
Best Ranking Factor: Total Motorcyclist Fatalities: 36th
Worst Ranking Factor: Total Driver Fatalities: 1st
Mississippi ranked 2nd in Total Passenger Fatalities and was the 3rd worst state for Total Fatalities by 100 Million Miles Driven. The state also had a 29.17 fatal crash rate per 100,000 state residents.
Drivers in Mississippi had the second-highest chance of being in a fatal crash; Wyoming took the #1 spot at a 32.76 fatal crash rate.
Mississippi may be the birthplace of Elvis Presley, but it needs to pick up the slack when it comes to the safety of its roads.
Best Ranking Factor: Total Pedacyclist Fatalities: 31st
Worst Ranking Factor: Total Fatalities by 100 Million Miles Driven: 4th
Kentucky is known for many fine things like bourbon, the Kentucky Derby, Chevrolet Corvettes, and Kentucky Fried Chicken. But things aren’t looking so good for drivers and passengers, since Kentucky ranked 6th in Total Driver Fatalities and 7th in Total Passenger Fatalities.
The Total Motorcyclist Fatalities category wasn’t too far behind at 9th place. Drivers in Kentucky need to be sure to pay attention behind the wheel as it may just help save a life.
Best Ranking Factor: Total Driver Fatalities: 29th
Worst Ranking Factor: Total Pedacyclist Fatalities: 4th
Arizona came in 6th for Total Pedestrian Fatalities and, once again, pedestrians and pedacyclists are getting the short end of the stick.
Arizona’s other three categories were all in the teens:
Arizona may be the biggest producer of copper in the U.S., but they are also leading the nation in traffic-related fatalities by being one of the 10 Worst States.
Best Ranking Factor: Total Driver Fatalities: 28th
Worst Ranking Factor: Total Pedacyclist Fatalities: 1st
Not only did Florida take 1st place for Total Pedacyclist Fatalities, but drivers in Florida took 2nd place for Total Pedestrian Fatalities and 4th place for Motorcyclist Fatalities as well.
To give you a better idea, here are the total fatalities for each of the three categories in 2015:
Seems like the forecast for the Sunshine State is starting to look a little gloomy. Hopefully Floridians will work harder to drive safely and keep themselves off our 10 Worst States list for next year.
Best Ranking Factor: Total Passenger Fatalities: 23rd
Worst Ranking Factor: Total Pedacyclist Fatalities: 2nd
Pedestrians, again, came in as the second worst ranking factor for Louisiana at 5th place with the Total Fatalities by 100 Million Miles Driven right behind at 6th place.
Out of the 761 total fatalities in Loiusiana, pedestrian and pedacyclist fatalities were a combined number of 136, contributing to almost 18 percent of the total fatalities in the state.
Louisiana may be the “Capital of the World” for crawfish, frogs, and ducks, but this needs to seriously improve when it comes to safe driving.
Best Ranking Factor: Total Passenger Fatalities: 11th
Worst Ranking Factor: Total Fatalities by 100 Million Miles Driven: 1st
South Carolina tied at 7th place for both Total Pedestrian Fatalities and Total Pedacyclist Fatalities. Total Driver Fatalities followed right behind at 8th place. Per 100,000 residents in SC, there’s a 28.72 traffic-related fatal crash rate.
And come to find out, there is a common denominator. The Insurance Institute for Highway Safety discovered that, in South Carolina, 82 percent of all fatal car accidents were on rural roads.
South Carolina drivers have a lot of work to do to stay off our list of 10 Worst States next year!
If you take a closer look at the four regions of the U.S. (North, South, West, and Midwest), you’ll start to notice a trend as relates to the rankings for states that are higher or lower for traffic-related fatalities.
The 10 Best States:
The 10 Worst States:
As a whole, the South has a lot of work to do; eight out of the 10 worst states are in the South! And the only two states left on the list, Arizona and New Mexico, are next-door neighbors. Additionally, four out of the 10 Worst States took first place in their worst ranking factors.
Out of all the categories, pedestrians and pedacyclists seem to be the most in danger. Pedestrian and Pedacyclist Fatalities were listed as the worst ranking factors in 13 out of the total 20 states discussed in both lists.
Even if your state made the 10 Worst States list, every state has laws in effect to make the roads safer. It is ultimately your responsibility to keep yourself and your passengers safe.
To further safeguard yourself and your vehicle, you can get more comprehensive auto insurance coverage. Compare at least three to four policies today by entering your ZIP code below!
In this article, we will discuss the 10 Worst States for Traffic-Related Fatalities. We used the following sources:
We ranked each state based on six specific categories:
Within each category, each state was given a total score. The best states received higher scores, and the worst states received lower scores. If you would like to see the ranking for all 50 states, you can view the spreadsheet here.
There are two other categories — Fatalities by Vehicle Position and Chances of Being in a Fatal Car Crash — listed on the spreadsheet that provided information for the six main categories and overall rankings.
We also took into consideration the historical data for crashes in the U.S., though it had no direct influence on our rankings.
– To sort the table by category, click on header columns.
– Click here for the full stats and sources for each category. For all media inquiries, please email: Josh Barnes
| STATE | TOTAL FATALITIES BY 100 MILLION MILES DRIVEN RANK | TOTAL DRIVER FATALTIES BY LICENSED DRIVERS RANK | TOTAL MOTORCYCLIST FATALITIES BY LICENSED DRIVERS RANK | TOTAL PASSENGER FATALITIES BY POPULATION RANK | TOTAL PEDESTRIANS FATALITIES BY POPULATION RANK | TOTAL PEDALCYCLIST FATALITIES BY POPULATION RANK | TOTAL SCORE | FINAL RANK |
|---|---|---|---|---|---|---|---|---|
| Alabama | 18 | 10 | 43 | 9 | 8 | 22 | 110 | 16 |
| Alaska | 16 | 39 | 29 | 39 | 11 | 47 | 181 | 31 |
| Arizona | 10 | 29 | 14 | 17 | 6 | 4 | 80 | 4 |
| Arkansas | 5 | 7 | 5 | 6 | 31 | 42 | 96 | 10 |
| California | 35 | 44 | 39 | 41 | 12 | 7 | 178 | 29 |
| Colorado | 29 | 35 | 18 | 30 | 31 | 12 | 155 | 26 |
| Connecticut | 45 | 42 | 29 | 47 | 26 | 45 | 234 | 47 |
| Delaware | 17 | 36 | 21 | 26 | 3 | 10 | 113 | 17 |
| District of Columbia | 49 | 51 | 51 | 51 | 23 | 33 | 258 | 49 |
| Florida | 9 | 28 | 4 | 25 | 2 | 1 | 69 | 3 |
| Georgia | 24 | 14 | 25 | 16 | 17 | 13 | 109 | 15 |
| Hawaii | 39 | 50 | 11 | 46 | 9 | 37 | 192 | 34 |
| Idaho | 15 | 16 | 14 | 5 | 42 | 47 | 139 | 23 |
| Illinois | 35 | 38 | 42 | 43 | 39 | 18 | 215 | 44 |
| Indiana | 31 | 21 | 22 | 22 | 28 | 23 | 147 | 25 |
| Iowa | 34 | 24 | 37 | 24 | 49 | 31 | 199 | 39 |
| Kansas | 27 | 19 | 26 | 18 | 46 | 42 | 178 | 29 |
| Kentucky | 4 | 6 | 9 | 7 | 26 | 31 | 83 | 5 |
| Louisiana | 6 | 13 | 16 | 23 | 5 | 2 | 65 | 2 |
| Maine | 30 | 27 | 7 | 28 | 48 | 47 | 187 | 33 |
| Maryland | 42 | 40 | 41 | 35 | 16 | 23 | 197 | 37 |
| Massachusetts | 51 | 49 | 49 | 50 | 36 | 38 | 273 | 51 |
| Michigan | 32 | 37 | 33 | 32 | 18 | 7 | 159 | 27 |
| Minnesota | 48 | 32 | 38 | 45 | 51 | 23 | 237 | 48 |
| Mississippi | 3 | 1 | 36 | 2 | 14 | 29 | 85 | 6 |
| Missouri | 24 | 12 | 24 | 14 | 33 | 33 | 140 | 24 |
| Montana | 2 | 3 | 8 | 3 | 40 | 42 | 98 | 11 |
| Nebraska | 23 | 17 | 40 | 13 | 50 | 17 | 160 | 28 |
| Nevada | 19 | 34 | 10 | 27 | 4 | 5 | 99 | 12 |
| New Hampshire | 44 | 41 | 22 | 42 | 40 | 13 | 202 | 40 |
| New Jersey | 47 | 46 | 50 | 44 | 10 | 18 | 215 | 44 |
| New Mexico | 28 | 22 | 20 | 12 | 1 | 6 | 89 | 7 |
| New York | 43 | 47 | 46 | 48 | 21 | 23 | 228 | 46 |
| North Carolina | 22 | 20 | 17 | 18 | 15 | 13 | 105 | 14 |
| North Dakota | 14 | 4 | 44 | 4 | 30 | 38 | 134 | 20 |
| Ohio | 32 | 26 | 28 | 35 | 44 | 16 | 181 | 31 |
| Oklahoma | 12 | 9 | 6 | 10 | 24 | 33 | 94 | 9 |
| Oregon | 21 | 23 | 26 | 29 | 19 | 18 | 136 | 22 |
| Pennsylvania | 26 | 31 | 32 | 40 | 25 | 40 | 194 | 35 |
| Rhode Island | 50 | 48 | 48 | 49 | 20 | 47 | 262 | 50 |
| South Carolina | 1 | 8 | 2 | 11 | 7 | 7 | 36 | 1 |
| South Dakota | 8 | 18 | 3 | 8 | 36 | 40 | 113 | 17 |
| Tennessee | 19 | 11 | 19 | 21 | 22 | 33 | 125 | 19 |
| Texas | 11 | 15 | 12 | 15 | 13 | 23 | 89 | 7 |
| Utah | 38 | 33 | 35 | 31 | 29 | 29 | 195 | 36 |
| Vermont | 46 | 45 | 31 | 32 | 45 | 3 | 202 | 40 |
| Virginia | 39 | 25 | 47 | 38 | 35 | 23 | 207 | 42 |
| Washington | 35 | 43 | 45 | 34 | 34 | 18 | 209 | 43 |
| West Virginia | 12 | 5 | 13 | 20 | 38 | 46 | 134 | 20 |
| Wisconsin | 39 | 30 | 34 | 37 | 47 | 11 | 198 | 38 |
| Wyoming | 6 |
Previous Rankings:
Features