8:00 - 17:00
Opening Hour: Mon - Fri

← VIEW THE UPDATED RESULTS HERE
October 31st – beloved, enchanted Halloween – will occur on a Thursday this year, 2019.
Will it be difficult for you to get home, eat dinner, and get in costume to join your family for trick-or-treating? Or are you one of the millions of Americans who work second or third shift and have to miss Halloween entirely this year?
The problems surrounding Halloween don’t end there. Most people have to get up early for work or school the next day, which is also a weekday this year.
Many adults and children alike dread when one of their all-time favorite holidays falls on a weekday. Sadly, when Halloween is a floating number on the calendar, it will fall on a weekday 71 percent of the time.
And, that’s not to mention an even bigger problem. Yes, walking around in costumes on the streets in the dark is downright spooky, which might feel fitting, but is it safe? Can all those vehicles see you and your kids when you cross the street to get to more houses?
No, it is not safe and we have 24 years of crash data to prove it. Check out this list of holidays with the most fatal crashes.
In response to these time conflicts and safety concerns, The Halloween & Costume Association (HCA) created a petition back in 2018 to move Halloween to the last Saturday in October. The primary goal is to create a safer, longer Halloween for families to enjoy together by utilizing daylight hours on a series of two days that most Americans have off of school and work.
Our research experts analyze the worst states for traffic-related fatalities all year long to determine trends and alert the public of major safety concerns. Halloween has been on our radar as being a deadly day for drivers, passengers, and pedestrians for awhile now. We would like to join and support the recent momentum to move Halloween to Saturday with some cold, hard fatal crash facts.
Table of Contents
There are definitely more than 10 reasons to move Halloween to the last Saturday in October, but we feel the below historically proven facts are enough to win the debate all on their own. To back this opinion piece, our researchers analyzed 24 years of traffic accident reports provided by the NHTSA.
We may not have 1 million Snickers bars to offer you, but we can give you the necessary facts you need to form an educated opinion on this controversial topic. At the very least, the below statistics should help motivate you to safeguard your loved ones while out celebrating Halloween each year.
Halloween creates life-threatening dangers to the youth of our nation that cannot be ignored. The fatal crash statistics are both heartbreaking and eye-opening. Halloween is ranked as the seventh most fatal holiday on the list of the 10 deadliest holidays to drive.
On average, when Halloween occurs on a weekday, there’s an 82.6 percent increase in fatal accidents involving children (aged 17 and under) after 4pm.
From 1994 to 2017 the 18 times that Halloween occurred on a weeknight, the number of fatal traffic accidents involving children jumped from 10-18. This means that weeknight Halloweens cause about eight more deadly crashes involving children than the average weeknight.
Every parent should be aware of the number of children who have died on Halloween each year, but unfortunately many people just associate Halloween with creative costumes, excited kids, fun parties, and lots of candy.
In 24 consecutive years, every single weekday Halloween experienced significant increases in fatal crashes involving pedestrians—fatal crashes in which at least one person was killed.
The 18 times that Halloween occurred on a Monday-Friday since 1994, there was an average 55 percent increase in fatal car crashes where one or more pedestrian was severally injured or killed.
In 2017, when Halloween fell on a Tuesday, 7,450 pedestrians were killed in the U.S. The National Safety Council reports that nearly 18 percent of those deaths occurred at road crossings or intersections.
On the 18 weekday Halloweens from 1994-2017, there was a nine percent average increase in fatal crashes. This equates to an average of 8.4 more fatal crashes on those weekday Halloweens than the daily average for the whole year.
In 24 years, one-third of the weekday Halloweens had a 20 percent or higher increase of fatal crashes. On all six of those Halloweens, there were at least 16 more fatal crashes than the typical daily average.
Let that sink in for a moment. One “fun” day caused sixteen more fatal crashes than the typical day for that year. Remember, one fatal crash often results in multiple injuries and deaths.
Halloween and Friday make for a downright deadly combination. In fact, we could adequately make the case to move Halloween to Saturday just by pointing out how deadly Halloweens on Friday have been.
Since 1994, every time Halloween occurred on a Friday, there was a 36 percent increase in fatal traffic accidents on average.
Every single Halloween that fell on a Friday in 24 years, there were at least 21 more fatal car accidents than what was typical for that year.
In 2008, the deadliest Halloween yet, there were 43 more fatal crashes than the daily average—yes, 43 more. Here’s the actual crash count: the daily fatal crash average in 2008 was 93, but on Friday, October 31st, there were 136. These crash spikes speak for themselves.
When looking specifically at fatal accidents that occurred on Halloween night (after 4pm) involving children, 17 and under, the statistics are alarming. Once parents discover how deadly Friday Halloweens have been for children, we are confident they will want it permanently moved to Saturday.
Is a couple hours of fun and a bucket of candy (mostly from strangers) worth risking your child’s life? Of course not.
In 24 years, here’s the breakdown for the five deadliest Halloweens to date:
| Day and Year | Fatal Crashes | Annual Average | Fatal Crash Increase | Percent Difference |
|---|---|---|---|---|
| Friday, 2014 | 19 | 6.6 | 12.4 | +188% |
| Friday, 2003 | 30 | 11.6 | 18.4 | +158% |
| Friday, 2008 | 20 | 8.3 | 11.7 | +140% |
| Thursday, 1996 | 32 | 13.4 | 18.6 | +139% |
| Tuesday, 2006 | 23 | 10.3 | 12.7 | +122% |
As you can see, Friday was the first, second, and third deadliest Halloween night since 1994 for our nation’s youth. When Halloween falls on a Friday, we can expect there to be about three times the number of fatal traffic accidents involving children that evening.
Again, we see that Friday Halloweens are so deadly they make the case for permanent Saturday Halloweens all on their own. When Halloween takes place on a Friday, there are shocking spikes in accidents resulting in deaths on not just one but two consecutive days. Take a look at the data in the chart below:
| Day and Date | Fatal Crashes | Annual Average | Fatal Crash Increase | Percent Difference |
|---|---|---|---|---|
| Friday 10-31-1997 | 123 | 102.2 | 20.8 | +20% |
| Saturday 11-1-1997 | 165 | 102.2 | 62.8 | +61% |
| Friday 10-31-2003 | 135 | 105.4 | 29.6 | +28% |
| Saturday 11-1-2003 | 170 | 105.4 | 64.6 | +61% |
| Friday 10-31-2008 | 136 | 93.4 | 42.6 | +46% |
| Saturday 11-1-2008 | 174 | 93.4 | 80.6 | +86% |
| Friday 10-31-2014 | 123 | 82.2 | 40.8 | +50% |
| Saturday 11-1-2014 | 132 | 82.2 | 49.8 | +61% |
Every time that Halloween has occurred on a Friday in 24 years, there has been a 20-86 percent increase in fatal crashes on both Halloween day (Friday) and the day after (Saturday).
When Halloween is on Friday, people tend to party harder, drink more, stay up later, take more risks, take less precautions . . . and these dangerous Friday celebrations cause dangers that roll right into Saturday.
After studying 24 years of fatal crash data surrounding Halloween, it was undeniable that Halloween causes increases in deaths from traffic accidents involving pedestrians, children, and the average American adult. However, Halloweens that fell on Saturday created a much lower fatal crash increase across two days.
When Halloween fell on a Friday, the average fatal crash increase for Halloween and the day after was 52 percent. While Saturday Halloweens and the day after had an average increase of 27 percent.
Is that 25 percent difference in increase not very impressive to you? Comparing the last three Friday Halloweens to the last three Saturday Halloweens will be.
There were 174 more fatal crashes on the Friday/Saturday combo compared to the Saturday/Sunday Halloween weekend. Take a look at the below graph illustrating just how much more dangerous Friday Halloweens are:
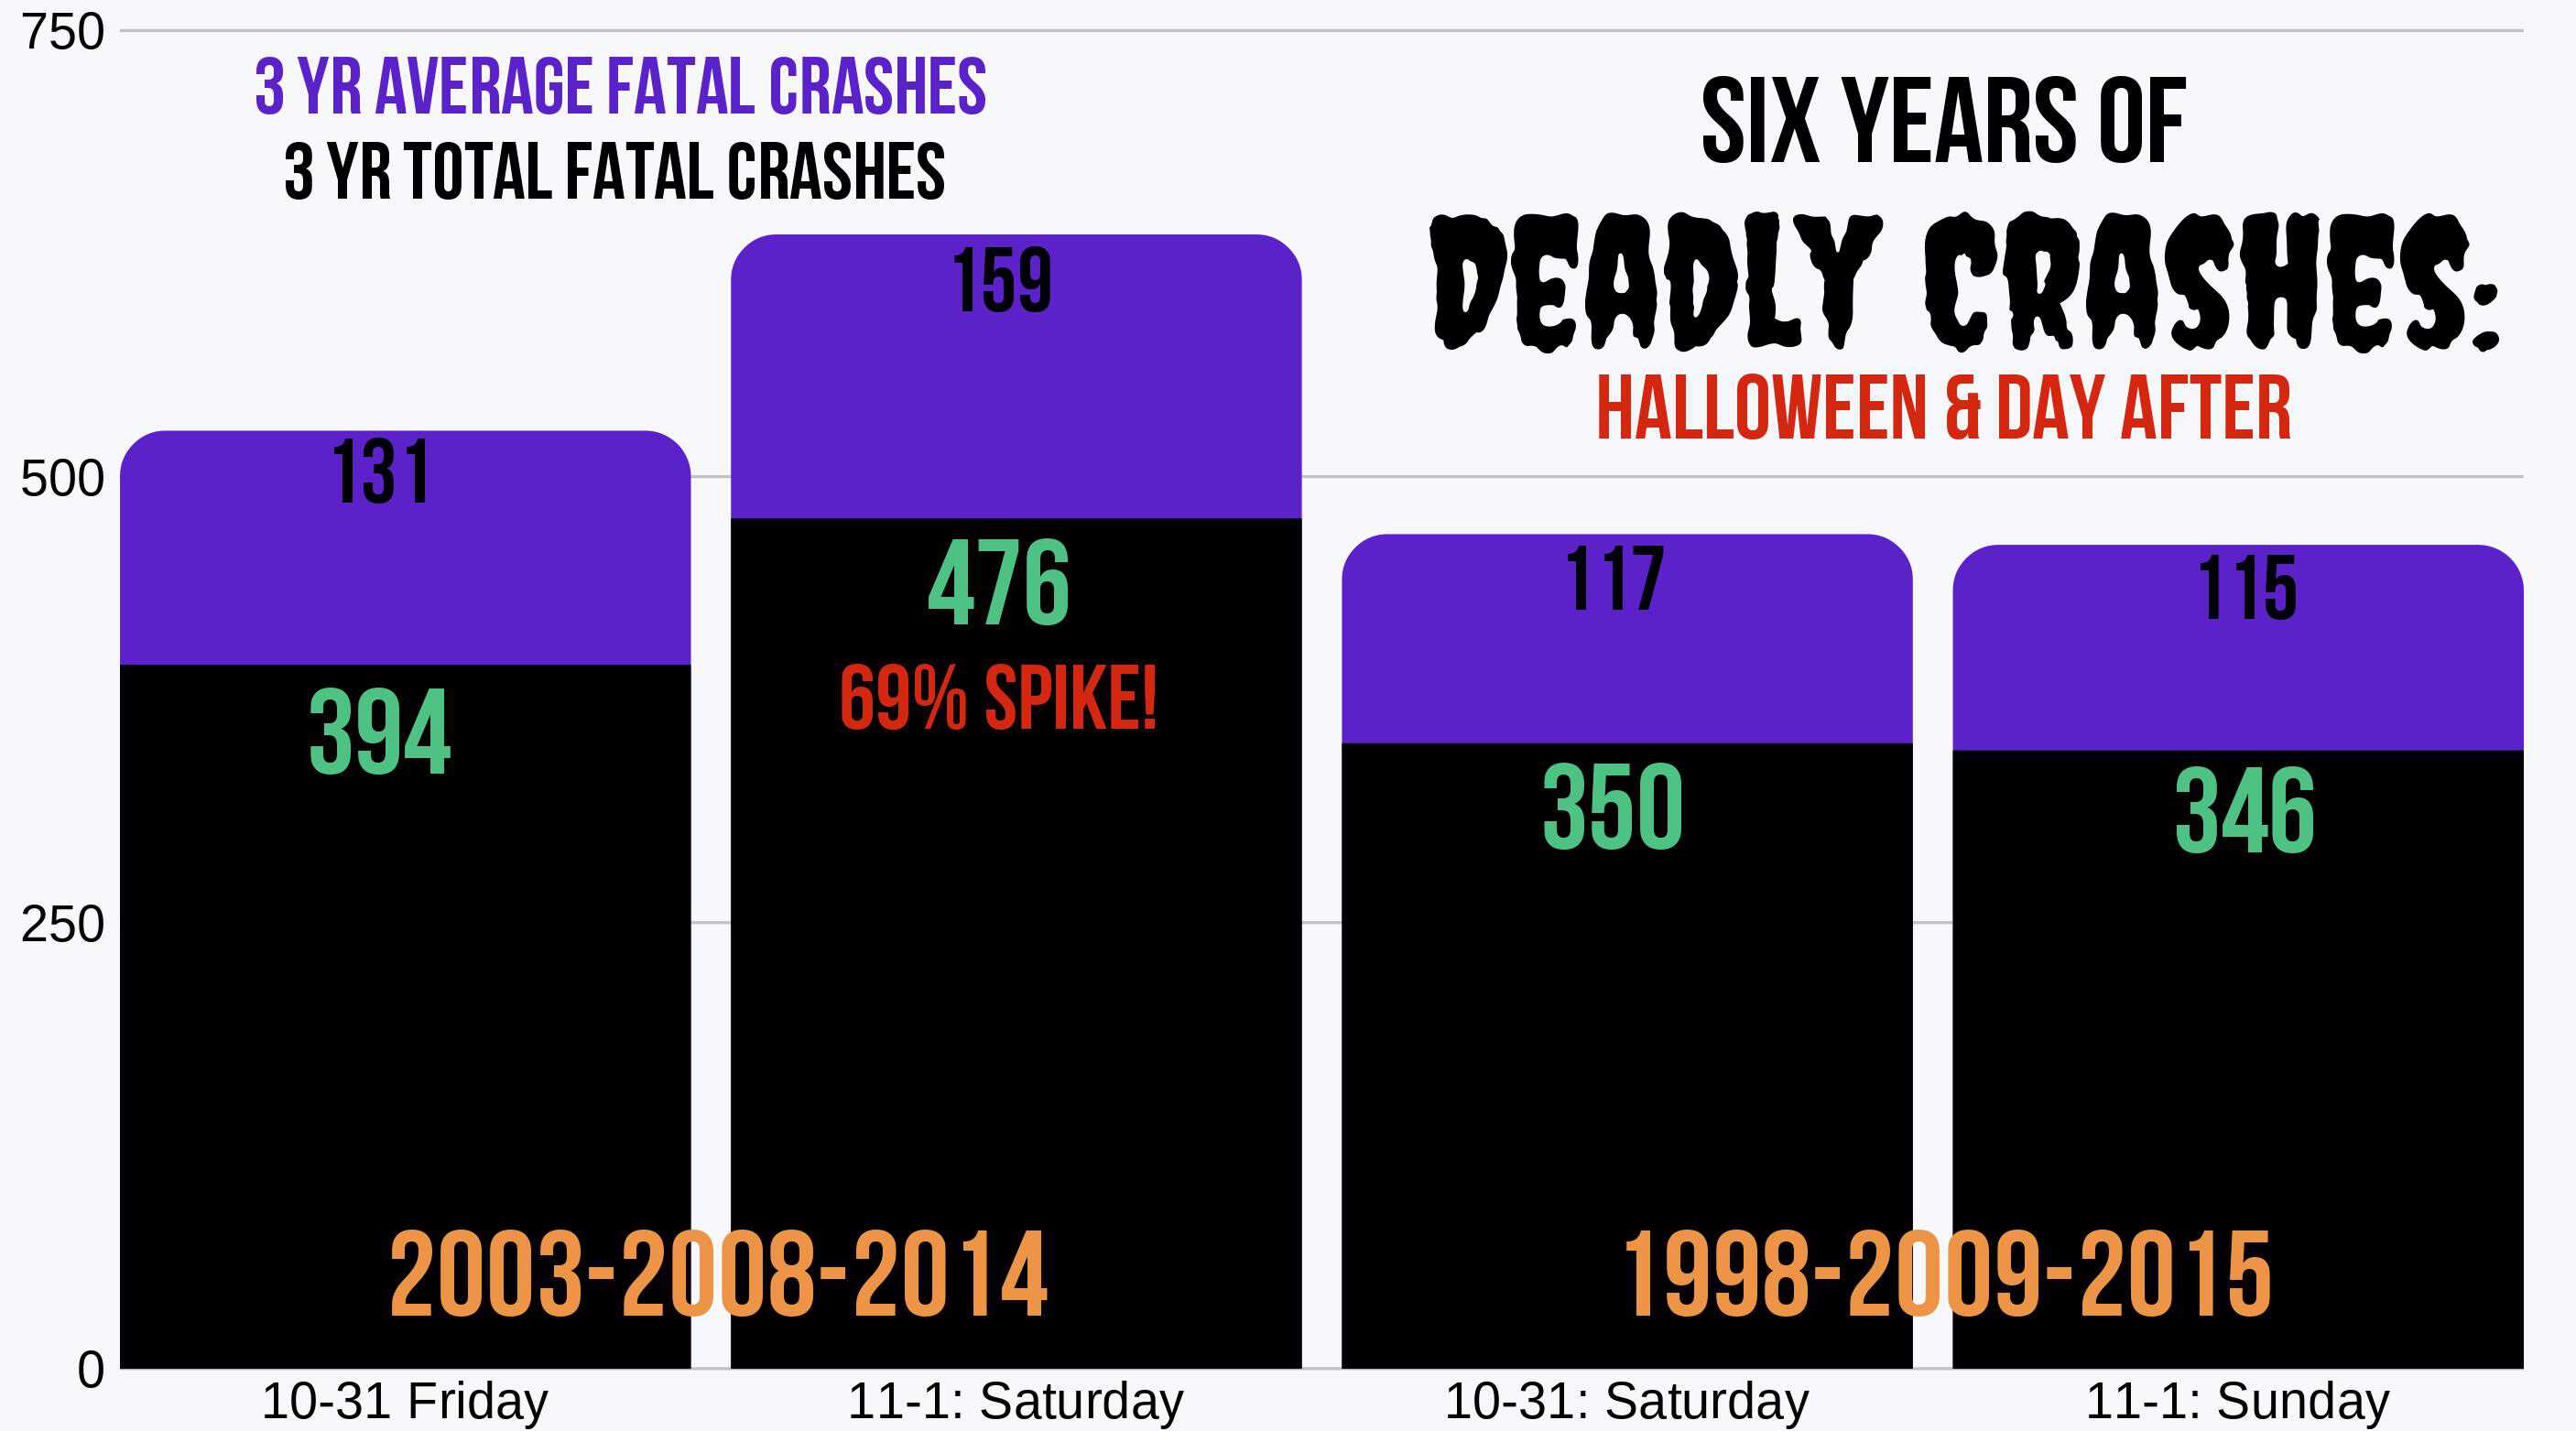
The two-day string of fatal crashes involving pedestrians when Halloween falls on Friday is haunting.
BEWARE! The history crash reports prove that the late Friday night Halloween celebrations and trick-or-treating make for deadly roads – especially for pedestrians – the following day, November first. See the pedestrian fatal crash totals and percent increases for the last four Friday Halloweens:
| Day and Date | Pedestrian Fatal Crashes | Annual Average | Pedestrian Fatal Crash Increase | Percent Difference |
|---|---|---|---|---|
| Friday 10-31-1997 | 17 | 14.4 | 2.6 | +18% |
| Saturday 11-1-1997 | 28 | 14.4 | 13.6 | +94% |
| Friday 10-31-2003 | 23 | 13 | 10 | +77% |
| Saturday 11-1-2003 | 24 | 13 | 11 | +85% |
| Friday 10-31-2008 | 24 | 12 | 12 | +101% |
| Saturday 11-1-2008 | 29 | 12 | 17 | +142% |
| Friday 10-31-2014 | 23 | 13.4 | 9.6 | +72% |
| Saturday 11-1-2014 | 33 | 13.4 | 19.6 | +147% |
Interestingly, there were the same total number of fatal traffic accidents involving pedestrians on the last three Friday Halloweens as there were on the last three Saturday Halloweens: 70 each. The scary spike in pedestrian fatalities, however, was seen the day after Halloween. Check out the graph below:
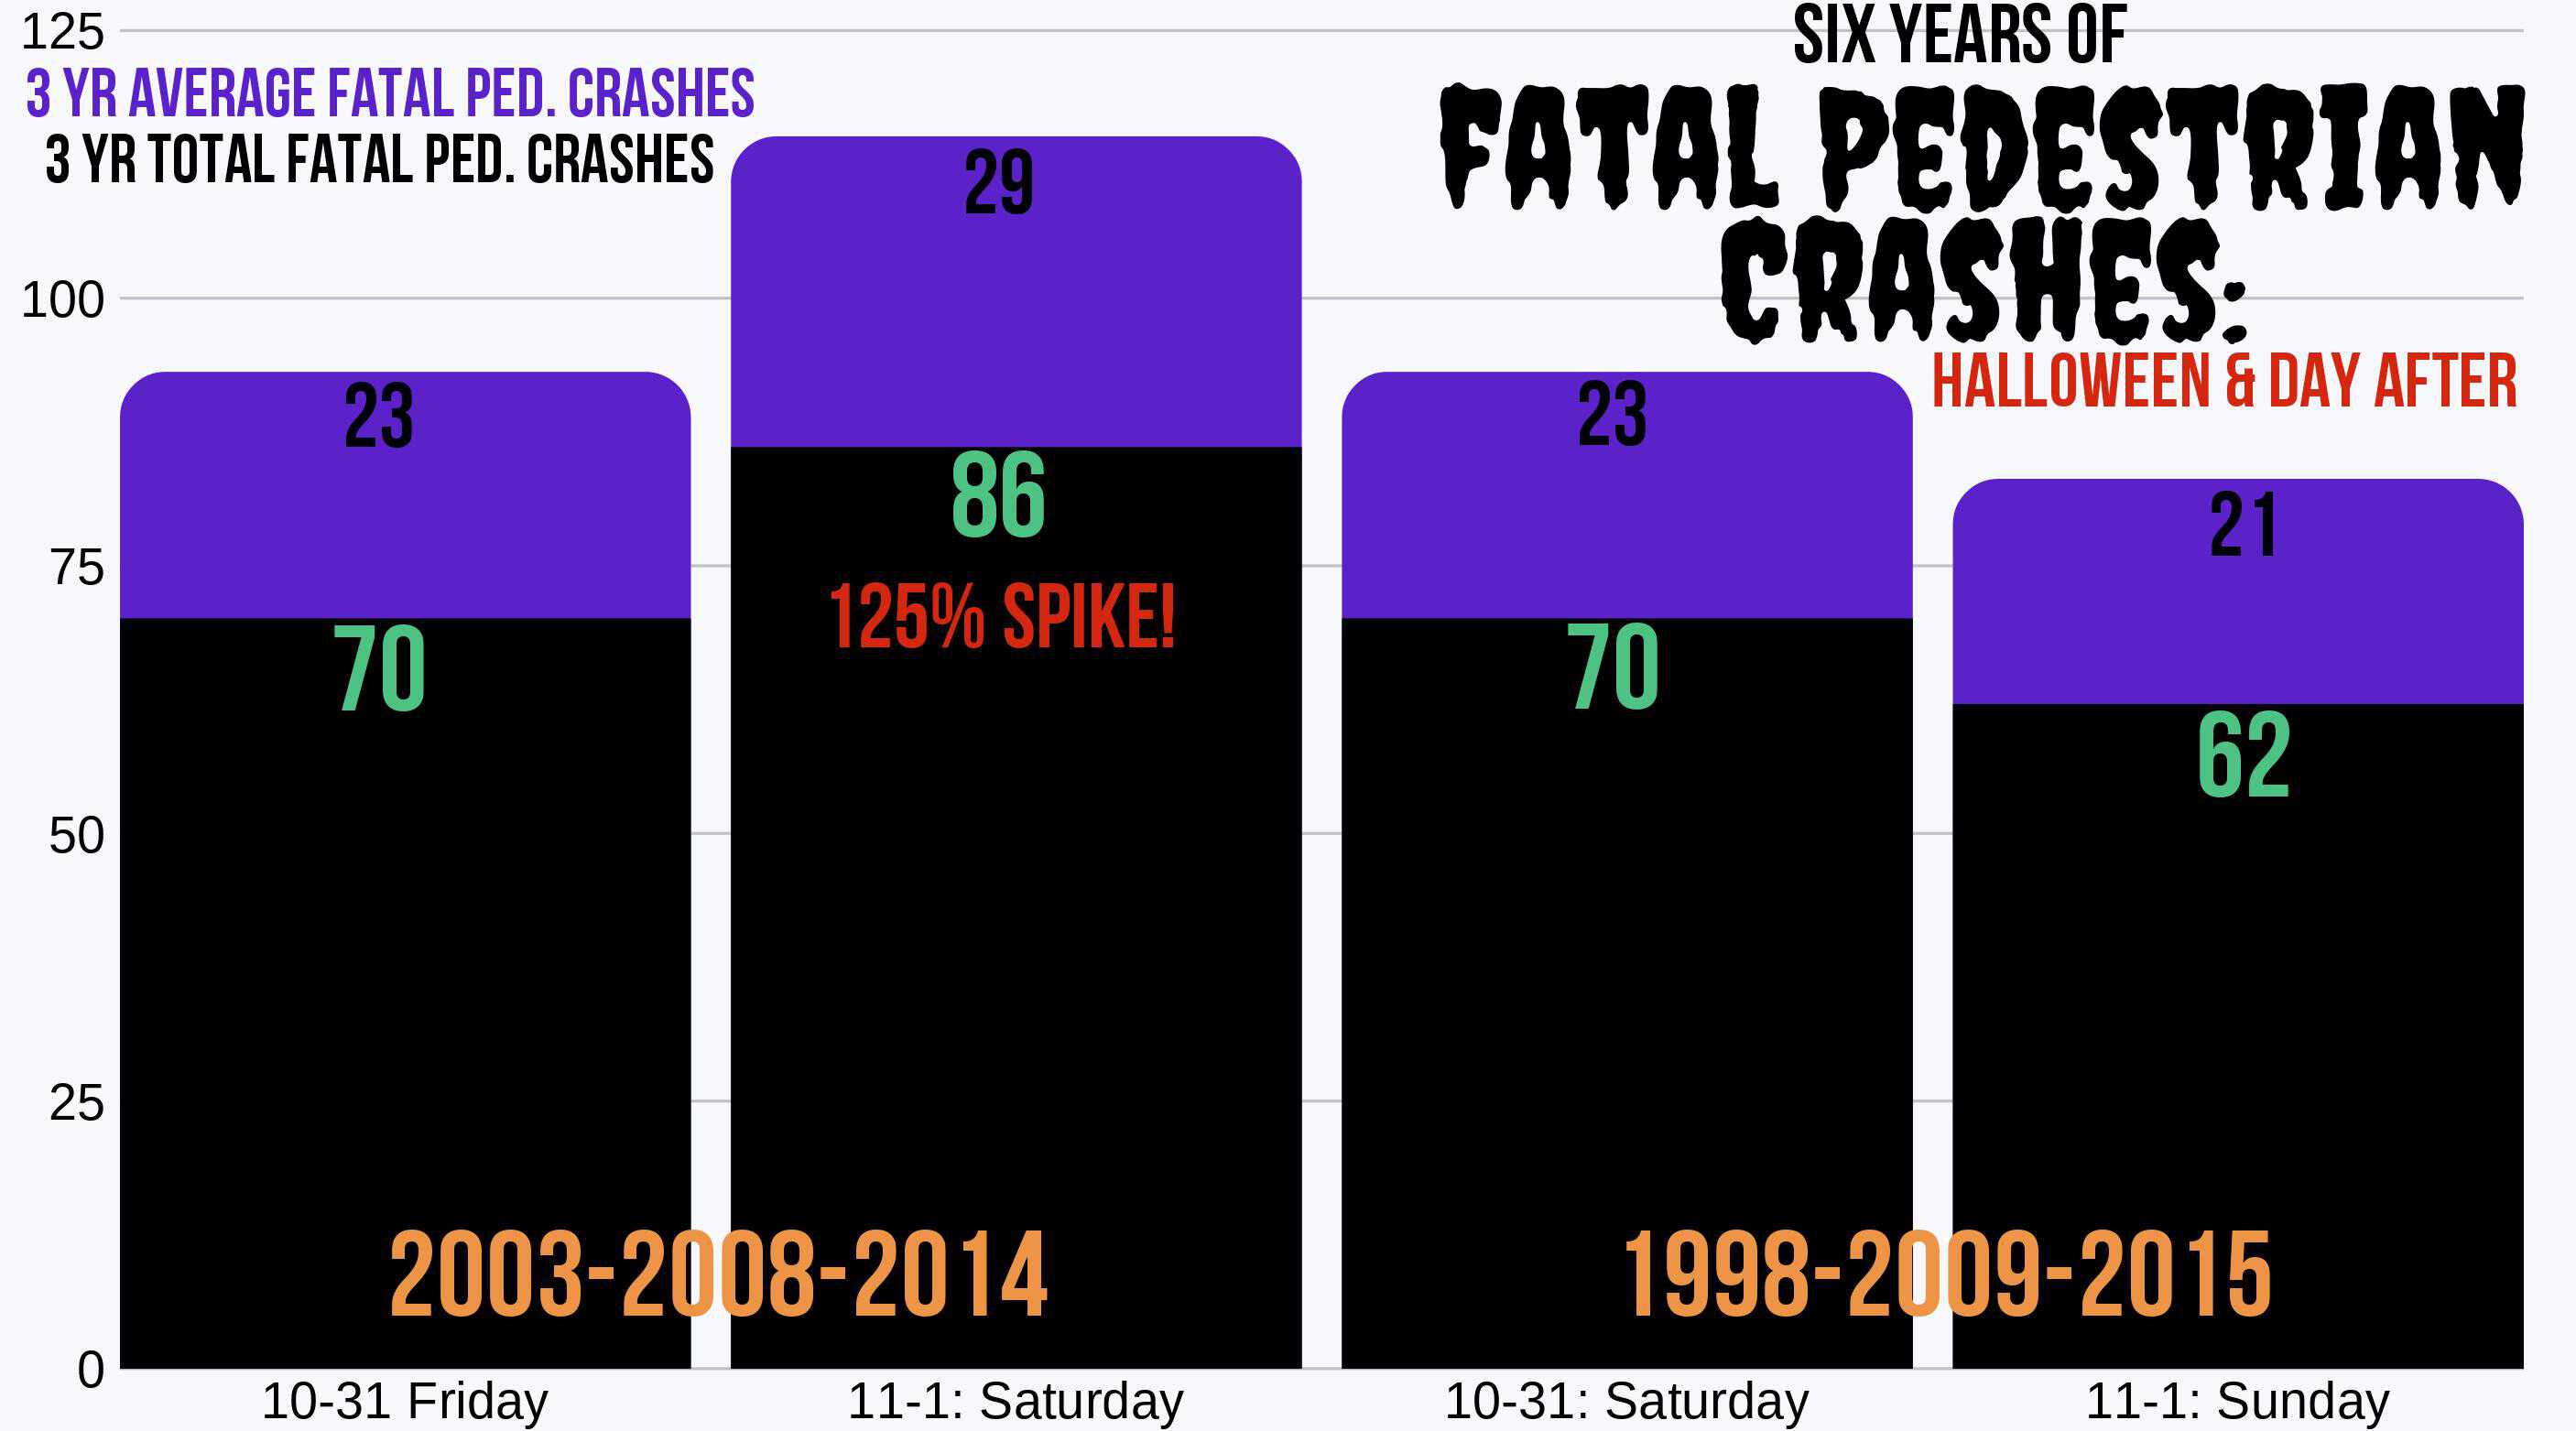
It’s undeniable the dangers Halloween causes. The three-year average increase in fatal accidents involving pedestrians the day after the Friday Halloweens was 125 percent!
While Halloween has shown to result in increased pedestrian fatal crashes regardless of what day it occurs, Halloweens on Saturday have been much safer historically. Below are some helpful safety tips you should follow this Halloween. Do your part to help bring down those chilling death counts.
The traffic accident reports show that Sunday is a safer day than most days for both deadly car accidents in general and car accidents resulting in deaths that involve pedestrians.
From 1994 to 2017 there were 1,253 Sundays, and over 27 percent of those Sundays experienced a DECREASE in fatal car accidents compared to the daily average for that year.
Plus, every year from 2013 to 2017, there was a decrease in fatal traffic accidents involving pedestrians on Sundays compared to the daily average for that year. See the specifics for each year below:
| Year | Average Pedestrian Fatal Crashes | Annual Avg: Pedestrian Fatal Crashes | Percent Difference |
|---|---|---|---|
| 2013 | 12 | 13 | -4% |
| 2014 | 13 | 13.4 | -6% |
| 2015 | 14 | 15 | -2% |
| 2016 | 16 | 16.5 | -1% |
| 2017 | 15 | 16.3 | -6% |
Sundays offer a safer, relaxing day for adults and children to recover from the higher sugar intake and partying from the night before.
Moving Halloween to Saturday makes for a less rushed, more enjoyable celebration where parents have more time and energy to take the extra steps necessary to keep their family safe while out trick-or-treating.
Each year there are about 4,500 Halloween-related injuries in the U.S. alone.
And, here are some more statistics provided by change.org illustrating why these injuries are so common on Halloween:
That last statistic is ominous. Twelve percent of American’s youngest kids – aged 0 to 5 – are alone, outside in the dark walking house to house likely with poor visibility due to their costumes. This has to change, folks! It’s not just getting hit by a car that’s likely.
Walking around alone at night when disguises are common, even expected, puts children at a much higher risk for violence and kidnapping. Watch the emotional video below showing just how vulnerable kids are when they go up to a stranger’s front door on Halloween.
As the video states at the end, “Not all monsters will look scary this Halloween.” Warn your kids of the dangers, take all the precautions you can, and stay close by them this Halloween, especially if the trick-or-treating takes place in the dark.
While these deadly events can result no matter what day Halloween falls on, we still felt that this was the best time to warn you. Here are more reasons to keep your guard up whatever day you celebrate this special holiday that Irish immigrants brought to the U.S. in the 1800s.
On Halloween, 14 percent of pedestrian deaths and 44 percent of people killed in car crashes all had a drunk driver to blame.
A recent survey conducted by the National Confectioners Association found that 90 percent of Americans claim the chocolate and candy make Halloween more fun.
As you can see, the dangers associated with Halloween don’t end on the dark streets at night—they continue to lurk over the following days and even weeks. Our team of insurance experts at Autoinsurance.org whole-hardheartedly believe that moving Halloween and all trick-or-treating to Saturday will prevent unnecessary injuries and save hundreds of lives.
Whether the actual day of Halloween is completely moved or a new holiday is created to occur on the last Saturday of October, something has to change. Trick-or-treating late at night in the dark is not safe especially while most Americans are tired and distracted from work and school earlier that day.
Twice as many children are killed while walking on Halloween than any other day of the year – we need to fix this.
Maybe you don’t have kids or are somehow unphased by the increased risks and traffic deaths. Even if you’re just a fan of Halloween for the parties and candy, there’s still reason for you to be a supporter of this movement; as Change.org put it:
“51 percent Of Millennials say Halloween is their favorite holiday, why cram it into two rushed evening weekday hours when it deserves a full day!?!”
The Halloween & Costume Association is pushing for a “Safer, Longer, Stress-Free Celebration” and so are we.
Using fatal crash reports provided by the FARS division of the NHTSA, our team of experts compiled over 300,000 unique data points in three specific areas – all organized by month, day and year:
Although our team has conducted thorough data-driven studies each month for nearly a decade, this particular study was one of the most in-depth to date as every single day for 24 years was compared to October 31st and November 1st to determine how Halloween and the day after affect the safety of American roads, pedestrians, and our youth.
Features