8:00 - 17:00
Opening Hour: Mon - Fri

| City Stats | Details |
|---|---|
| Population | 200,965 |
| Population Density | 5,216 people/square mile |
| Average Annual Cost of Insurance | $3,176.60 |
| Cheapest Car Insurance Company | Liberty Mutual |
| Road Conditions | Poor share: 28% Mediocre share: 35% Fair share: 14% Good share: 22% Vehicle operating costs: $627 |
Settlers from New York founded Aurora in 1834. As a trading point and mill site near a Potawatomi Indian village, it was then called McCarty’s Mills and was later renamed in 1837. This residential and industrial suburb about 40 miles west of Chicago was also among the first U.S. cities to install electric street lights.
It’s also known as the fictional hometown of Wayne Campbell and Garth Algar, played by comedians Mike Myers and Dana Carvey in “Wayne’s World.” Originally a “Saturday Night Live” sketch in the early 1990s, the teenage metalheads broadcast a public-access TV show from Wayne’s parents’ basement. They shot to superstardom with their own feature film in 1992.
Twenty-five years later, Aurora honored the duo — which made the city famous — with a recreation of the original movie set.
In one of the film’s funniest moments, the pair and their friends sing-along and “headbang” to Queen’s “Bohemian Rhapsody.” Fortunately, everyone was OK. But, if you goof around like that while you drive, you want to make sure you have enough insurance coverage in case of an accident.
If you need help shopping for car insurance, you’ve come to the right place. This is your complete guide to car insurance in Aurora. We’ll explore car insurance rates, coverage available, the factors that determine your auto insurance rates there, and much more.
So, strap yourself in and get ready for a pleasant ride. If you want to start researching rates, enter your zip code in the tool above.
Table of Contents
The average price of an annual full coverage auto insurance premium in Aurora is $3,176.60. If you pay a lot for premiums, it can be an expense you’d rather avoid.
What city you reside in will impact your car insurance. That’s why it’s essential to compare Aurora, IL against other top US metro areas’ auto insurance costs.
The good news is, this guide is here to help you save money. We’ll explore how much each company charges for different coverage, the factors that affect your rates, and many more topics related to car insurance. We partnered with Quadrant to give you the data in the sections below.
So, read on, to find out more about how much you could save today.
According to Data USA, the median age in Aurora is 33. Regardless of your age, your gender can also affect how much you pay for your premiums. In Illinois and many other states, the practice of basing insurance rates on gender is legal.
Age is a significant factor for Aurora, IL car insurance rates. Young drivers are often considered high-risk. This Aurora, Illinois does use gender as a car insurance factor, so check out the average monthly auto insurance rates by age and gender in Aurora, IL.
Though women typically pay less for car insurance than men, a recent Chicago-Sun Times investigation found that they’re sometimes charged more based on some of the factors further below. But, first, let’s see how rates vary by age:
| 35 | 60 | 17 | 25 | Cheapest Rate | Cheapest Age |
|---|---|---|---|---|---|
| $1,956.78 | $1,836.69 | $7,038.38 | $2,329.79 | $1,836.69 | 60 |
Aurora, Illinois car insurance costs by company and age is an essential comparison because the top car insurance company for one age group may not be the best provider for another age group.
Veteran drivers age 60 and older pay less for their premiums than younger drivers. Insurers can see older, more experienced drivers as less of an insurance risk. Now let’s see how the cost differences between the sexes compare.
| Male | Female | Cheaper |
|---|---|---|
| $3,290.41 | $3,109.50 | Female |
The average price difference between male and female car insurance customers in Aurora is less than $200.00. As we’ll show below, a wage gap between the sexes still exists, too. Now, let’s see how much insurers charge married and single car insurance customers of all ages and genders.
| Demographic | Rate (Cheapest) |
|---|---|
| Single 25-year old male | $2,435.21 |
| Single 25-year old female | $2,224.37 |
| Single 17-year old male | $7,613.32 |
| Single 17-year old female | $6,463.45 |
| Married 60-year old male | $1,872.37 |
| Married 60-year old female | $1,801.00 |
| Married 35-year old male | $1,964.37 |
| Married 35-year old female | $1,949.19 |
| Average | $3,290.41 |
Single 17-year-old males face the highest premiums of nearly $8,000 while married 60-year-old females pay an average of more than $6,000 less.
As the Sun-Times report we mentioned earlier noted, your zip code can factor into your insurance costs. The zip code in Aurora where residents pay less for car insurance is 60502, where the cost of a full coverage premium averages $3,176.60.
ZIP codes will play a major role in your auto insurance rates because factors like crime and traffic are calculated by the ZIP code. Find more info about the monthly Aurora, IL auto insurance rates by ZIP Code below:
Here we’ll go over how the top insurers’ prices vary in general, and how your job affects car insurance, as well as how coverage level and credit history set your rates.
The cheapest Aurora, IL car insurance providers can be found below. You also might be wondering, “How do those Aurora, IL rates compare against the average Illinois car insurance company rates?” We uncover that too
Look below to see how much big-name insurers in the area charge different ages and genders.
| Group | Married 35-year old female | Married 35-year old male | Married 60-year old female | Married 60-year old male | Single 17-year old female | Single 17-year old male | Single 25-year old female | Single 25-year old male | Average |
|---|---|---|---|---|---|---|---|---|---|
| Allstate | $3,245.52 | $3,259.64 | $3,404.68 | $3,404.68 | $8,560.09 | $11,120.77 | $3,904.23 | $4,220.90 | $5,140.06 |
| American Family | $2,239.29 | $2,239.29 | $2,058.01 | $2,058.01 | $6,481.76 | $8,923.07 | $2,239.29 | $2,895.51 | $3,641.78 |
| Farmers | $2,486.06 | $2,482.75 | $2,196.95 | $2,334.29 | $11,180.86 | $11,660.08 | $2,842.40 | $2,955.79 | $4,767.40 |
| GEICO | $1,746.60 | $1,800.37 | $1,710.60 | $1,926.37 | $6,266.59 | $6,471.24 | $1,992.48 | $2,065.71 | $2,997.50 |
| Liberty Mutual | $1,397.95 | $1,505.36 | $1,160.91 | $1,296.79 | $4,913.31 | $5,460.25 | $1,456.82 | $1,527.76 | $2,339.89 |
| Nationwide | $1,683.75 | $1,705.44 | $1,506.81 | $1,586.11 | $4,647.99 | $5,922.04 | $1,964.76 | $2,117.55 | $2,641.81 |
| Progressive | $2,110.18 | $1,972.70 | $1,747.44 | $1,834.63 | $7,994.78 | $8,953.26 | $2,507.30 | $2,702.74 | $3,727.88 |
| State Farm | $1,554.12 | $1,554.12 | $1,409.35 | $1,409.35 | $5,002.85 | $6,310.38 | $1,764.09 | $2,038.97 | $2,630.40 |
| Travelers | $1,556.67 | $1,639.07 | $1,442.63 | $1,534.40 | $4,736.66 | $5,993.59 | $1,644.69 | $1,729.66 | $2,534.67 |
| USAA | $1,471.74 | $1,484.98 | $1,372.65 | $1,339.10 | $4,849.61 | $5,318.48 | $1,927.68 | $2,097.49 | $2,482.72 |
On average, USAA and Liberty Mutual’s premiums cost from $100 to almost $2,000 less than their competitors.
How far you drive also affects how much you pay for auto insurance. Generally, the more miles you drive regularly, the higher your premiums. In Illinois, drivers average 12,528 miles yearly.
| Group | 10 miles commute. 6000 annual mileage. | 25 miles commute. 12000 annual mileage. | Average |
|---|---|---|---|
| Allstate | $5,140.06 | $5,140.06 | $5,140.06 |
| American Family | $3,595.73 | $3,687.82 | $3,641.78 |
| Farmers | $4,767.40 | $4,767.40 | $4,767.40 |
| GEICO | $2,946.48 | $3,048.51 | $2,997.50 |
| Liberty Mutual | $2,339.89 | $2,339.89 | $2,339.89 |
| Nationwide | $2,641.81 | $2,641.81 | $2,641.81 |
| Progressive | $3,727.88 | $3,727.88 | $3,727.88 |
| State Farm | $2,564.23 | $2,696.58 | $2,630.41 |
| Travelers | $2,435.06 | $2,634.28 | $2,534.67 |
| USAA | $2,413.46 | $2,551.98 | $2,482.72 |
As shown, some insurers factor distance into their rates while others don’t. Among those who do, such as Travelers, the price difference between a ten-mile and a 25-mile commute can cost as much as $200.
The amount of insurance you buy, whether you purchase just the state-required minimum liability or full coverage results in an obvious price difference. But, it’s interesting to see how much it can vary with each option.
Your coverage level will play a major role in your Aurora, IL car insurance costs. Find the cheapest Aurora, Illinois car insurance costs by coverage level below:
| Group | High | Low | Medium | Average |
|---|---|---|---|---|
| Allstate | $5,307.00 | $4,978.09 | $5,135.10 | $5,140.06 |
| American Family | $3,665.47 | $3,483.97 | $3,775.90 | $3,641.78 |
| Farmers | $5,146.04 | $4,512.85 | $4,643.30 | $4,767.40 |
| GEICO | $3,299.26 | $2,702.07 | $2,991.16 | $2,997.50 |
| Liberty Mutual | $2,481.46 | $2,203.18 | $2,335.05 | $2,339.90 |
| Nationwide | $2,653.71 | $2,603.04 | $2,668.67 | $2,641.81 |
| Progressive | $4,088.25 | $3,384.45 | $3,710.93 | $3,727.88 |
| State Farm | $2,788.34 | $2,466.87 | $2,636.00 | $2,630.40 |
| Travelers | $2,701.81 | $2,370.81 | $2,531.39 | $2,534.67 |
| USAA | $2,663.57 | $2,303.94 | $2,480.64 | $2,482.72 |
With Nationwide, the price difference between low and high coverage amounts to only $50.00 on average. However, with Progressive, it’s as much as $700. This shows that you have options and sometimes full coverage is more affordable than you might have thought.
It’s probably not too surprising that auto insurance companies check credit as another factor in your rates. The higher your score, usually, the less you’ll pay. Let’s see how much credit history influences top insurers’ prices.
Your credit score will play a major role in your Aurora, IL car insurance costs unless you live in these states where discrimination based on credit is not allowed: California, Hawaii, Massachusetts, and North Carolina. Find the cheapest Aurora, IL car insurance costs by credit score below.
| Group | Fair | Good | Poor | Average |
|---|---|---|---|---|
| Allstate | $4,736.05 | $4,146.28 | $6,537.87 | $5,140.07 |
| American Family | $3,301.81 | $2,798.19 | $4,825.34 | $3,641.78 |
| Farmers | $4,563.36 | $4,339.21 | $5,399.63 | $4,767.40 |
| GEICO | $2,346.78 | $1,825.81 | $4,819.90 | $2,997.50 |
| Liberty Mutual | $2,072.67 | $1,646.42 | $3,300.59 | $2,339.89 |
| Nationwide | $2,550.65 | $2,231.89 | $3,142.88 | $2,641.81 |
| Progressive | $3,607.56 | $3,341.18 | $4,234.90 | $3,727.88 |
| State Farm | $2,290.12 | $1,775.98 | $3,825.12 | $2,630.41 |
| Travelers | $2,503.68 | $2,023.71 | $3,076.62 | $2,534.67 |
| USAA | $2,275.22 | $1,880.85 | $3,292.08 | $2,482.72 |
All the insurers shown change their rates in Aurora based on credit scores. With Geico, a driver with poor credit can pay as much as $3,000 more than one who has good credit.
Auto insurance companies check your driving record, whether it’s shabby or spotless. This can also help or hurt your rates. Let’s see how much they can change with common driving infractions.
Your driving record will affect your Aurora, IL car insurance costs. For example, a Aurora, Illinois DUI may increase your car insurance costs 40 to 50 percent. Find the cheapest Aurora, Illinois car insurance costs by driving record.
| Group | Clean record | With 1 accident | With 1 DUI | With 1 speeding violation | Average |
|---|---|---|---|---|---|
| Allstate | $3,622.62 | $6,275.55 | $5,846.09 | $4,815.99 | $5,248.09 |
| American Family | $2,675.96 | $3,805.60 | $5,051.53 | $3,034.02 | $3,844.36 |
| Farmers | $4,018.99 | $5,201.85 | $5,072.09 | $4,776.66 | $4,764.31 |
| GEICO | $2,012.91 | $3,271.58 | $4,339.50 | $2,365.99 | $3,208.00 |
| Liberty Mutual | $1,942.40 | $2,778.18 | $2,429.74 | $2,209.26 | $2,383.44 |
| Nationwide | $2,143.86 | $2,752.20 | $3,220.51 | $2,450.66 | $2,705.52 |
| Progressive | $3,061.48 | $4,586.41 | $3,398.17 | $3,865.46 | $3,682.02 |
| State Farm | $2,383.46 | $2,877.35 | $2,630.40 | $2,630.40 | $2,630.40 |
| Travelers | $2,012.60 | $2,649.93 | $2,952.05 | $2,524.11 | $2,538.19 |
| USAA | $1,765.75 | $2,551.53 | $3,481.77 | $2,131.82 | $2,599.68 |
Some insurers, like Liberty Mutual, don’t raise their rates much for one speeding ticket. But, with Allstate, they can soar to as much as $1,200.
We’ve seen how much some major insurance companies examine certain parts of a driver’s life and habits to adjust their car insurance rates. In this section, we’ll look more closely at other factors, such as the local economy, your earnings, job, and education level.
Controlling these risk factors will ensure you have the cheapest Aurora, Illinois car insurance. Factors affecting car insurance rates in Aurora, IL may include your commute, coverage level, tickets, DUIs, and credit.
The Brookings Institution’s Metro Monitor reveals that the Chicago-Naperville-Elgin area ranks 18th out of 100 cities nationwide for growth and prosperity. This is a sign of a strong economy, and as one of the highest populated areas in the U.S., its long-term vitality makes it hard to beat.
Prosperity
Prosperity captures changes in the average wealth and income an economy produces. When worker productivity contributes to a metropolitan area’s growth, through innovation or training, for example, the value of those workers’ labor rises.
This is how the area grew from 2007 to 2017:
Levels of productivity and the standard of living remained high, however, the average annual wage was fairly low, ranking the area in the middle of the cities surveyed.
Growth
Growth indicators measure the change in the size of an urban area’s economy and its level of entrepreneurial activity. Growth and entrepreneurship create new opportunities for individuals and can help a metro economy become more efficient. These figures measure growth in the gross metropolitan product, the number of jobs, and the number of positions at young firms.
Here’s how the Chicago area grew from 2007 to 2017:
The area performed best in gross metropolitan product, a financial measure of the goods and services produced. But, it lagged in job growth.
Now, let’s discover more about how growth and prosperity affect you in Aurora, and in turn, your car insurance costs.
According to Census.gov, Aurora households have a median annual income of $66,848, which is more than the median U.S. yearly income of $60,336. In Aurora, annual earnings rose 4.5 percent from an average of $63,967 in 2016. With earnings of $66,848, and the average annual cost of premiums at $3,176.60, 4.75 percent of residents’ average disposable income pays for car insurance.
Want to see how much of your earnings go to auto insurance coverage? Try our free calculator below.
CalculatorPro
Homeownership shows that a driver may be more reliable and able to pay car insurance premiums. If you own a home, you may pay less for car insurance than if you rent. To save more, homeowners can also bundle their home and car insurance.
In 2017, owner-occupied buildings accounted for 64.7 percent of the housing units in Aurora. This percentage is higher than the national average of 63.9 percent. The chart below shows the homeownership percentage in Aurora with the median property values.
Aurora appears in orange and the gray bars represent the U.S. Homeownership rates in Aurora rose past the national averages, especially for those in high-income brackets.
Your level of education — whether you have a high school or a college degree — also factors into your insurance rates. Let’s look at your options for furthering your education there.
As shown in the Data USA chart above, Aurora University graduated the most students, awarding 1,590 degrees in 2016. The video below details what it’s like to attend the school:
Community colleges, which grant degrees and certificates in several fields, often cost less to attend than traditional schools. Waubonsee Community College offers degrees and certificates in such programs as Business, Social and Behavioral Science, and Industry & Manufacturing, well-suited for the most common occupations in Aurora.
Data wasn’t available at the county level, so the data below shows wages by race and ethnicity for the entire state of Illinois.
Data USA reports that In 2017, the highest paid race/ethnicity of Illinois workers was Asian. These workers were paid 1.17 times more than Whites, who made the second highest salary of any race/ethnicity.
This chart below shows the average percentage of income each of the top three races and ethnicities pay for car insurance.
| ANNUAL CAR INSURANCE | ANNUAL INCOME | % OF INCOME | NOTES |
|---|---|---|---|
| $3,176.60 | $56,297 | 5.64% | White |
| $3,176.60 | $46,947 | 6.77% | Native Hawaiian or Other Pacific Islander |
| $3,176.60 | $65,613 | 4.84% | Asian |
As shown, less of the higher-earning races and ethnicities’ incomes go to coverage.
The data below shows wage by gender for the top five full-time occupations by the number of employees in Illinois.
In 2017, male employees in Illinois made $71,579, which was 1.37 times more than female workers, who earned $52,403. Overall, across the professions, there was a wage gap, however, it was most apparent in management positions.
With an average annual car insurance premium of $3,176.60 in Aurora, males who earn $71,579 pay 4.44 percent of their income to car insurance. Females who earn $52,403, spend 6.06 percent of the earnings on their premiums.
According to Data USA, these are the poverty rates by age and gender in Aurora.
The Census Bureau sets income thresholds that change by household size and composition to determine who classifies as impoverished. If a household’s total income falls below the limit for impoverishment, the individuals are considered to be living in poverty.
Thirteen percent of the population for whom poverty status is determined in Aurora (26,100 out of 199,000 people) live below the poverty line, which matches the national average. The largest demographic living in poverty are girls ages 6-11, followed by women ages 25-34 and 35-44.
These are Data USA’s poverty rates by race and ethnicity in Aurora. The most common racial or ethnic group living below the poverty line in Aurora is Hispanic, followed by White and “other.”
As shown in the Data USA data following, from 2016 to 2017, employment in Aurora grew at a rate of 1.72 percent, from 97,800 employees to 99,400 employees.
The most common jobs by the number of people living in Aurora are office and administrative support occupations (13,105 people), sales and related (11,610 people), and production jobs (9,389 people).
Aurora might not have the most congested traffic, but as you head into Chicago, you can get stuck in some long lines. Traffic jams can turn an enjoyable drive into an annoying trip pretty quickly.
To reduce your stress, we’ll cover the vital aspects of Aurora’s roadways: major highways, toll roads, pavement conditions, popular road trips, and traffic laws.
Keep reading to find out more.
What are the highways like in Aurora? Where will you need to pay tolls? Will a speeding or red light camera catch you? We’ll answer these questions and more below.
Illinois has 24 active highways that span 2,203.42 miles throughout the state. Below is a map of the major highways that run through Aurora.
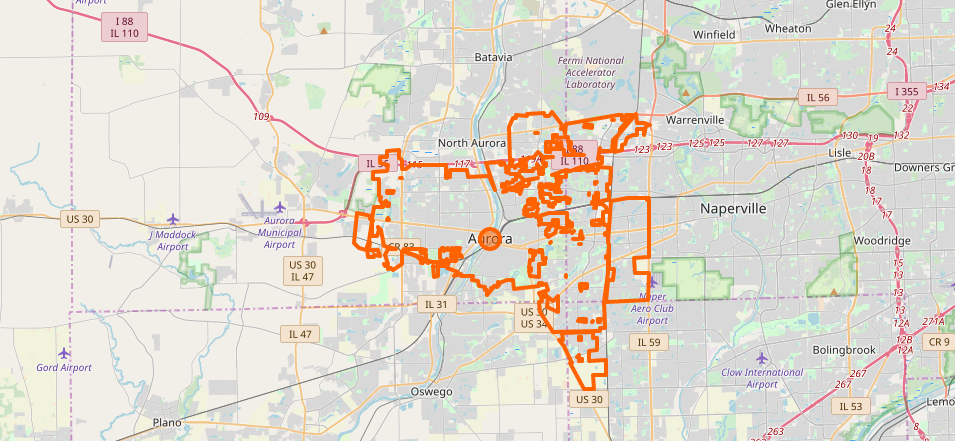
These are the state, interstate, and U.S. highways in Aurora:
Interstate Highways
Interstate 88 (I-88) – Ronald Reagan Memorial Tollway stretches along I-88 near Silvis and Moline to an interchange with I-290 and I-294 in Hillside, near Chicago. The highway runs through Aurora, Naperville, DeKalb, and Dixon. Toll rates vary depending on the route. The Illinois Tollway features an interactive map of the toll routes.
If you take this route regularly, you can register for an I-Pass (like an E-Z Pass on east coast toll roads). You can install this electronic tag in your windshield to pass through tolls without stopping and will be billed later. You may also use I-Pass on toll roads that accept E-Z Pass.
US Highways
Illinois Highways
To find out about ongoing road conditions, the Illinois Department of Transportation provides a map for travelers; you can also get information about current construction in the area. An alternative is to follow Tollway Trip Tweets to see if there are any accidents or delays — just be careful not to check them while you’re driving.
This “big rig” travel video shows what it’s like to drive along stretches of I-88:
Enter your ZIP code below to view companies that have cheap auto insurance rates.
 Secured with SHA-256 Encryption
Aurora has its share of local attractions to visit for fun and recreation. Among them are the Splash County Water Park, the Water Lantern Festival, pumpkin seller Abbey Farm, and the oldest farmers market in Illinois.
The city also offers opportunities for sightseeing, arts and culture, more festivals and holidays, and sports activities. You’ll find plenty of things to do throughout Aurora.
Watch the video below for exciting events and attractions in the village of North Aurora:
Below are pavement conditions and vehicle operating costs in the Chicago area from TRIP, a national transportation research group:
| Poor Share | Mediocre Share | Fair Share | Good Share | Vehicle Operating Costs (VOC) |
|---|---|---|---|---|
| 28% | 35% | 14% | 22% | $627 |
More than one-third of area roads are in mediocre, or in moderate condition, while more than one-quarter of them are in poor shape. Together, your chances of driving on cracked, uneven pavement and potholes is more than 50 percent compared to roads in fair and good condition. So, be careful while you drive in the area.
According to the Insurance Institute for Highway Safety (IIHS), Aurora doesn’t have any speeding camera laws. It is, however, among the red light camera communities across the U.S.
So, if you run a red light, you don’t just risk your life and others’, you also could face being photographed to show evidence of your crime. The City of Aurora website lists the camera locations and the penalties for offenders.
With car ownership, you may deal with problems, such as traffic congestion, busy highways, road hazards, and potential vehicle theft. We’ll cover these issues and more facts involving car ownership below.
In Chicago, according to YourMechanic, 51 percent of drivers own American cars, which ranked the city 30th out of 81 metro areas. The most popular make and model there is the Chevrolet Monte Carlo.
Made from 1970 to 2007 as a luxury coupe, it was a stylish addition to Chevrolet’s vehicle line. The 2007 model received three, four, and five-star safety ratings from the National Highway Traffic Safety Administration (NHTSA).
MotorWeek’s classic video (below) reviews the 1983 SS model:
According to Census.gov, most households in Aurora own two cars, followed by three vehicles, which is slightly higher than the national average.
The table below reveals how many Aurora households on average own and don’t own cars.
| 2015 Households Without Vehicles | 2016 Households Without Vehicles | 2015 Vehicles Per Household | 2016 Vehicles Per Household |
|---|---|---|---|
| 4.00% | 3.80% | 1.98 | 1.94 |
In 2015 and 2016, most New York city households didn’t own cars and those that did just owned one.
According to Speedtrap.org users, Indian Trail between Farnsworth and Eola Road and State Route 31 near Oak Street are among the areas in Aurora where speeders should be wary.
The Federal Bureau of Investigation reports that in 2017, 176 motor vehicle thefts occurred in Aurora.
Neighborhood Scout tracks crime statistics for U.S. cities. Below is their map of the safest neighborhoods in Aurora. Frontenac tops the list.
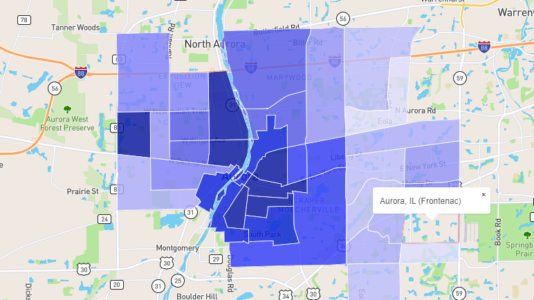
In Neighborhood Scout’s Crime Index, Aurora ranks 43rd, which means that it’s safer than 43 percent of other U.S. cities.
Your chances of becoming a victim of violent crime are one in 387 in Aurora, but statewide, that number falls to one in 228.
Most of the crimes are property crimes, such as theft and vandalism. Here is a closer look at the violent crimes that occur annually in Aurora.
| Aurora Violent Crimes | MURDER | RAPE | ROBBERY | ASSAULT |
|---|---|---|---|---|
| Report Total | 5 | 57 | 108 | 349 |
| Rate per 1,000 | 0.02 | 0.28 | 0.54 | 1.74 |
The majority of the crimes are robberies and assaults.
This section features information about traffic congestion in the Chicago metropolitan area, the busiest highways, and the safety of the streets and roads.
Aurora itself isn’t known for high traffic congestion. But, nearby Chicago ranks with traffic monitors, including INRIX. Their Traffic Scorecard rates Chicago as the 23rd most congested city worldwide. It’s also the third most traffic-congested city in the U.S.
In 2018 alone, drivers there spent 138 minutes daily in traffic jams. That amounts to transportation expenses of $1,920 per driver for costs such as gasoline and car repairs.
During morning and afternoon commute times, drivers travel at peak speeds of 23 miles per hour. In the morning, Chicago drivers can expect to add 13 minutes to each 30-minute trip. Evening commuters log an extra 17 minutes for every 30-minute trip.
On top of that, TomTom reports the worst day for traffic congestion in Chicago is February 5th (a Monday). The best day, a gift to many drivers if they must travel on that date, is Christmas (December 25th).
This Associated Press news report discusses the top Chicago traffic “bottleneck”:
On average, drivers in Aurora have a longer commute time (27.6 minutes) than the typical American worker (25.1 minutes). Further, three percent of Aurorans commute longer than 90 minutes.
In 2017, most commuters in Aurora drove alone, followed by those who carpooled and took public transportation.
In this section, you’ll find out how many fatal accidents happened on Aurora’s roads in 2017, courtesy of the National Highway Traffic Safety Administration (NHTSA). We’ll cover everything from the total fatalities by the county to vehicle and railroad accidents.
To help you interpret the statistics, we’ve included data for more than one county. That’s because Aurora spans four counties: DuPage, Kane, Kendall, and Will. As of the 2010 census, DuPage was the most populated county, with 916,924 people. Will County followed with 692,661 residents, Kane with 534,667, and Kendall had 126,218 people.
First, let’s see how many fatal accidents occurred overall among the counties in 2017.
| County | 2017 |
|---|---|
| Dupage | 40 |
| Kane | 39 |
| Kendall | 6 |
| Will | 59 |
Will County, with the second-highest population, suffered the most fatalities. Surprisingly, DuPage and Kane tied in second place.
These are the fatalities in crashes involving an alcohol-impaired driver with a Blood Alcohol Content (BAC) of .08 or higher.
| County | 2017 |
|---|---|
| Dupage | 7 |
| Kane | 7 |
| Kendall | 3 |
| Will | 21 |
Sadly, again, Will County topped the list, followed by Kane and DuPage counties. Here are the deaths in crashes that involved a single vehicle.
| County | 2017 |
|---|---|
| Dupage | 15 |
| Kane | 11 |
| Kendall | 3 |
| Will | 23 |
Will again ranks at the top, while DuPage and Kane ranked a distant second and third. Kendall County, with the lowest population, continues to rank 4th.
Next, these are the fatalities that involved speeding.
| County | 2017 |
|---|---|
| Dupage | 17 |
| Kane | 18 |
| Kendall | 5 |
| Will | 34 |
Unfortunately, Will County’s deaths from speeding-related crashes are nearly double those of Kane County, in second place. This shows that speeding is a major problem there that should be addressed. Next, we have crashes that involved a roadway departure.
| County | 2017 |
|---|---|
| Dupage | 11 |
| Kane | 12 |
| Kendall | 8 |
| Will | 34 |
Again, Will County tops the list, with almost triple the fatalities of Kane County, which ranked a distant second place. Now, we have the numbers of fatalities involving or related to an intersection.
| County | 2017 |
|---|---|
| Dupage | 22 |
| Kane | 8 |
| Kendall | 2 |
| Will | 15 |
DuPage topped this list, possibly because there may be more intersections there. Below are the numbers of deaths involving passenger car occupants:
| County | 2017 |
|---|---|
| Dupage | 13 |
| Kane | 15 |
| Kendall | 6 |
| Will | 36 |
Will County again dominates, with more than two times the crash fatalities of second-place Kane County. Now, we have crash deaths involving pedestrians.
| County | 2017 |
|---|---|
| Dupage | 9 |
| Kane | 4 |
| Kendall | 0 |
| Will | 3 |
DuPage county, with its higher population, had the most pedestrian/motor vehicle crashes.
We evaluated fatal pedacyclist/motor vehicle fatalities in all four counties in 2017, but NHTSA statistics show none occurred. Below are NHTSA Fatality Analysis Reporting System (FARS) statistics for fatal crashes on different types of roads in Illinois.
An arterial road is a high-capacity urban road. Depending on the amount of traffic, the arterial road may be classified as a highway or a minor arterial road. A collector road gathers traffic from local roads and takes drivers to arterial roads.
| INTERSTATE (RURAL) | INTERSTATE (URBAN) | FREEWAY AND EXPRESSWAY | OTHER PRINCIPAL ARTERIAL | MINOR ARTERIAL | COLLECTOR ARTERIAL | LOCAL | UNKNOWN | TOTAL FATAL CRASHES |
|---|---|---|---|---|---|---|---|---|
| 53 | 87 | 10 | 277 | 257 | 217 | 98 | 6 | 1005 |
Most accidents in the state happened on arterial roads.
Finally, these are the U.S. Department of Transportation’s railroad and highway crash incidents in three of the four counties.
| Calendar Year | County | Highway | Highway User Type | Rail Equipment Type | nonsuicidefatality | nonsuicideinjury | City |
|---|---|---|---|---|---|---|---|
| 2012 | KANE | RAYMOND STREET | Automobile | Psgr Train | 0 | 3 | ELGIN |
| 2014 | KANE | SOUTH ELGIN ROAD | Automobile | Freight Train | 0 | 1 | |
| 2014 | KANE | PRITCHARD ROAD | Automobile | Freight Train | 0 | 0 | MAPLE PARK |
| 2016 | KANE | KIMBALL STREET | Pedestrian | C | 1 | 0 | ELGIN |
| 2013 | KENDALL | VON EMMON RD. | Automobile | Freight Train | 0 | 0 | YORKVILLE |
| 2013 | KENDALL | JACKSON STREET | Automobile | Freight Train | 0 | 0 | OSWEGO |
| 2014 | KENDALL | LIGHT RD | Pedestrian | Psgr Train | 0 | 1 | |
| 2015 | WILL | ROWELL AVE | Pedestrian | Freight Train | 1 | 0 | JOLIET |
| 2015 | WILL | CICO ROAD | Truck-trailer | Freight Train | 0 | 1 | |
| 2015 | WILL | PRIVATE YARD CROSSIN | Automobile | Yard/Switch | 0 | 0 | JOLIET |
| 2015 | WILL | HAFENRICHTER ROAD | Pick-up truck | Freight Train | 0 | 0 | |
| 2015 | WILL | NEW RIVER RD | Truck-trailer | Psgr Train | 0 | 16 | |
| 2015 | WILL | FIRST STREET | Automobile | Psgr Train | 0 | 2 | WILMINGTON |
| 2015 | WILL | HAFENRICHTER ROAD | Automobile | Freight Train | 0 | 0 | |
| 2015 | WILL | 111TH ST | Van | Freight Train | 1 | 0 | |
| 2016 | WILL | RIVER ROAD | Automobile | Freight Train | 0 | 0 | |
| 2016 | WILL | LARAWAY ROAD | Truck-trailer | Psgr Train | 0 | 2 | |
| 2016 | WILL | PATTERSON RD | Automobile | Freight Train | 0 | 0 | |
| 2016 | WILL | LORENZO RD | Automobile | Freight Train | 0 | 1 | WILMINGTON |
| 2016 | WILL | TINLEY PARK PED | Pedestrian | Psgr Train | 1 | 0 | TINLEY PARK |
Will County, sadly, had the most crash incidents. DuPage County didn’t make the list.
Allstate America’s Best Driver’s Report tracks the numbers of accident claims drivers make nationwide. In 2018, Aurora ranked 74th out of 200 major cities, down from 84th the prior year. The chart below shows Aurorans’ insurance claim and hard braking statistics.
| Average Years Between Claims | Relative Claim Likelihood (Compared to National Average) | 2018 Drivewise® Hard-Braking Events Per 1,000 Miles |
|---|---|---|
| 8.7 | 15.40% | 26.2 |
Drivers in Aurora went nearly nine years between accident claims, and they were 15 percent more likely to file a claim compared to the national average. They had 26 hard-braking events per 1,000 miles.
Overall, these results show that Aurora’s drivers work hard to drive safely.
Beyond regular taxi rides, below are the ridesharing services available in Aurora.
A program from Esurance, Estar helps drivers find the best repair shops in their areas. According to Estar, these are the top ten repair shops in and around Aurora:
GERBER – NAPERVILLE/LASALLE ST.
1880 LASALLE AVENUE
NAPERVILLE, IL 60563
email: [email protected]
P: (630) 983-0900
F: (630) 983-9820
CARSTAR NORTH AURORA COLLISION CENTER
1 S. RIVER RD.
NORTH AURORA, IL 60542
email: [email protected]
P: (630) 859-8008
SERVICE KING NORTH AURORA
207 HANSEN BLVD.
NORTH AURORA, IL 60542
email: [email protected]
P: (630) 907-0511
SERVICE KING NAPERVILLE
24125 W. 111th St. Suite 700
NAPERVILLE, IL 60564
email: [email protected]
P: (630) 778-6888
F: (630) 778-9447
SERVICE KING PLAINFIELD
12319 S. RT. 59
PLAINFIELD, IL 60585
email: [email protected]
P: (815) 439-5959
FIX AUTO FOX VALLEY
1214 FOUNDRY ST.
SAINT CHARLES, IL 60174
email: [email protected]
P: (630) 443-4380
SERVICE KING ROMEOVILLE
1303 NAPERVILLE DRIVE
ROMEOVILLE, IL 60446
email: [email protected]
P: (630) 783-8800
CARSTAR YORKVILLE
228 ROUTE 34
YORKVILLE, IL 60560
email: [email protected]
P: (630) 553-6564
LOMBARD BODY & FENDER SHOP INC.
27 E WILLOW ST.
LOMBARD, IL 60148
email: [email protected]
P: (630) 627-8688
F: (630) 627-8690
SERVICE KING LOMBARD
816 EAST ROOSEVELT RD.
LOMBARD, IL 60148
email: [email protected]
P: (630) 932-0943
F: (630) 932-1655
U.S. Climate Data shows that Aurora’s temperatures aren’t too high or too low throughout the year, with average highs of 59 and lows of 41 degrees. Rainfall and snowfall are also moderate.
| Aurora weather averages | |
|---|---|
| Annual high temperature: | 59°F |
| Annual low temperature: | 41.3°F |
| Average temperature: | 50.15°F |
| Average annual precipitation - rainfall: | 37.67 inch |
| Days per year with precipitation - rainfall: | - |
| Annual hours of sunshine: | - |
| Av. annual snowfall: | 29 inch |
City-Data shows that Aurora averages 14 natural disasters yearly, which almost matches the U.S. average of 13. Every year, roughly four natural disasters lead to emergency declarations and ten of them are presidential declarations.
Below is a breakdown of the causes of disasters. Note: some incidents may be assigned to more than one category.
Overall, the area receives several floods and storms yearly and occasional winter storms and tornadoes. It also sometimes sees hurricanes, blizzards, and high winds.
Because of the unpredictable nature of weather, it makes sense to buy comprehensive car insurance for protection from floods and storms and other hazards that can damage your vehicle.
Aurora offers several forms of public transportation, including bus service and the Metra Railway. Read on to find out more about each service.
Pace Suburban Bus is among the largest transportation services in the U.S. It operates throughout Cook, Will, DuPage, Kane, Lake, and McHenry counties and carries more than 100,000 riders daily. The service takes riders to work, school, and other destinations.
The fixed-route bus service follows a set schedule and routing. With approximately 200 fixed routes that serve more than 220 communities in six counties, Pace provides fast and economical service to employment centers, hospitals, shopping centers, and many other attractions.
Riders can pay their fares with cash or a Ventra Card. The cost varies by route. Passengers may get a Ventra Card and register a transit account at ventrachicago.com or call 1.877.NOW.VENTRA.
Registered Ventra Card users can load multi-day passes and transit value to their card, and have their balance protected if the card is lost or stolen. Cash payments must be exact because the driver doesn’t carry change. Transfers are available only with Ventra Cards.
Metra Railway runs through the Aurora Transportation Center that also serves several Pace bus routes. Aurora is the west end of the BNSF Railway Line from Chicago and is 38.4 miles (61.8 km) from Chicago’s Union Station, the east end of the BNSF Railway Line. More than 2,000 commuters use this station daily. The cost of fares changes with the route.
As stated at the city’s website, Aurora aims to be a bicycle-friendly community and promotes bicycling throughout the city. In downtown Aurora, a green dedicated bike lane protects riders from traffic and connects to major regional trails and sharrows alert vehicles to routes bicyclists often use.
In June 2016, the city partnered with Zagster, Inc. to launch its Bike Share program — the first of its kind in the city.
Rides cost up to $20. You can pay $1 for every 30 minutes of use. Zagster will charge you an additional $30 for keeping a bike over 24 hours. They also offer pay-as-you-go plans, annual student memberships, and ride passes (valid through September).
Bike Share membership is open to all members of the public 18 years of age or older. You must have a valid credit or debit card to become a member. You also need to use a mobile device to sign up through the Zagster app.
The City of Aurora operates commuter parking lots at each of the Downtown and Route 59 Metra stations and offers metered parking lots downtown. Free parking up to one hour is available at the Stolp Island Parking Garage at the corner of Downer Place and Stolp Avenue.
Reasonable rates are available there if you need to park longer. After 5 p.m., the city offers public parking at the northwest corner of River and New York Streets in the West Suburban Bank parking lot until 3 a.m.
Parking is also free on certain holidays.
Commuter parking: At the Downtown station, parking is available at the lot next to the Aurora Transportation Center on the west side of the platform with more parking available east of the platform near Spring Street and Lincoln Avenue. At the Route 59 Station, the City of Aurora operates the parking lot south of the platform.
Monthly passes for the stations are available, but there is a waiting list. You can visit the iParq website to add yourself to the list.
Daily parking costs $2 for every 24 hours at the Downtown and Route 59 stations. You must pay when you park with cash, a credit card, through the Parkmobile app, or with a pre-paid parking card.
If you pay with cash, the parking terminal requires exact change. The city charges a 31-cent fee for credit card transactions, and 55 cents via Parkmobile (available for Android and ioS).
There are no extra charges with the pre-paid parking card, which costs $8.00 and you can load up to $100 with it via cash or a credit card.
You can buy the cards in person at the Aurora City Hall Motor Vehicle Parking Division office or mail a completed pre-paid parking card application (PDF) with a check made payable to the City of Aurora Revenue and Collections Division.
Downtown parking: The City of Aurora uses five color-coded categories for on-street and lot parking with different time limits. Parking spaces closer to the center of the downtown are more popular, therefore, parking times are more limited than in other areas.
Below is a list of the color codes and parking time limits for them:
| Color Category | On-Street Time Limits | Parking Lot Time Limit |
|---|---|---|
| Platinum | 90 Minutes | N/A |
| Gold | 2 Hours | 2 Hours |
| Silver | 2 Hours | 3 Hours |
| Bronze | 3 Hours | 6 Hours |
| Mercury | 5 Hours | 10 Hours |
ChargeHub lists 71 of the most popular electric car charging stations within ten miles of Aurora. Twenty-four of them are free. More than 72 percent of them are Level Two, however, 15 percent are Level Three charging stations. The main charging networks are Blink and ChargePoint.
Pollution from vehicle exhaust has been linked to health issues and even climate change. The pollution not only goes directly into the earth’s atmosphere, but it also reacts with other pollutants which make the situation worse. Children and people with chronic illnesses can be most sensitive to the effects.
Below are the Environmental Protection Agency (EPA) air quality statistics for DuPage, Kane, and Will counties.
| DuPage County Air Quality Index | 2016 | 2017 | 2018 |
|---|---|---|---|
| Days With AQI | 241 | 311 | 361 |
| Good Days | 194 | 237 | 231 |
| Moderate Days | 38 | 72 | 126 |
| Days Unhealthy for Sensitive Groups | 9 | 2 | 4 |
| Unhealthy Days | - | - | - |
| Very Unhealthy Days | - | - | - |
In DuPage County, the air quality has improved in recent years, with more “good” days and fewer “days unhealthy for sensitive groups.”
| Kane County Air Quality Index | 2016 | 2017 | 2018 |
|---|---|---|---|
| Days With AQI | 358 | 353 | 364 |
| Good Days | 305 | 291 | 294 |
| Moderate Days | 45 | 61 | 65 |
| Days Unhealthy for Sensitive Groups | 8 | 1 | 5 |
| Unhealthy Days | - | - | - |
| Very Unhealthy Days | - | - | - |
Kane County air quality stats show that from 2016 to 2018, the levels of pollution have remained steady.
| Will County Air Quality Index | 2016 | 2017 | 2018 |
|---|---|---|---|
| Days With AQI | 365 | 365 | 365 |
| Good Days | 283 | 289 | 261 |
| Moderate Days | 81 | 76 | 100 |
| Days Unhealthy for Sensitive Groups | 1 | - | 4 |
| Unhealthy Days | - | - | - |
| Very Unhealthy Days | - | - | - |
Like Kane, Will County’s air quality has, for the most part, remained steady recently, however, there were fewer “good” days and more “days unhealthy for sensitive groups.”
Motor vehicle exhaust emissions are a significant source of pollution, including carbon monoxide, nitrogen oxides, and hydrocarbons. They can harm people’s health and the environment and lead to ground-level ozone (smog). Vehicle exhaust is among the major sources of air pollution in the Chicago and Metro-East St. Louis areas.
The Illinois Environmental Protection Agency’s vehicle emissions inspection program helps improve air quality and public health in Illinois. The Illinois Vehicle Emissions Inspection Law of 2005 (625 ILCS 5/13C) requires a vehicle emissions inspection program to reduce air pollution from motor vehicles in these areas of Illinois.
Through an On-Board Diagnostic (OBD) test, vehicle emissions inspections identify malfunctioning emission control systems that often exceed federal emission standards.
Most 1996 and newer gasoline-powered passenger vehicles are subject to emissions inspections after they are four years old — for example, 2012 cars were inspected for the first time in 2016. The inspection month coincides with the expiration date of the vehicle license plate.
Typically, even model-year vehicles are inspected during even years and odd model-year vehicles in odd-numbered years.
If you’re an active member of the military or a veteran, it can be hard to find time to research car insurance discounts that may be available to you. What’s available and who offers them?
To ease the task, we’ve collected the most crucial information you need about military discounts together with some facts about the military in the area.
If you’re ready to learn more, read on.
Most military veterans in Aurora served in Vietnam, almost two times more than military personnel in other conflicts. Members of the armed forces who served in the most recent Gulf War follow them.
Naval Station Great Lakes – North Chicago (NSGL), the largest military installation in Illinois, operates closest to Aurora. Since its founding in 1911, Great Lakes has maintained its position as the U.S. Navy’s largest training facility. It’s also the home of the Navy’s only boot camp.
Since World War I, it has trained and sent more than two million new sailors through the Recruit Training Command. NSGL supports over 50 tenant commands and elements as well as over 20,000 sailors, marines, soldiers, and Department of Defense civilians who live and work there.
If you are or were in the U.S. military, most car insurance companies will want to give back to you through military discounts. Here is a list of known providers who give military discounts. We excluded those who offer military discounts only to certain states.
| Insurance Company | Percentage Saved with Discount |
|---|---|
| Farmers | 5% |
| Geico | 15% |
| Liberty Mutual (must be active duty) | 4% |
| MetLife | 15% |
| USAA | 60% off when deployed 15% for garaging on base |
*USAA gives a 15 percent military garage discount for garaging cars on a military base.
USAA provides car insurance only to U.S. military personnel and their families. The company’s insurance premiums tend to cost less than those of standard insurers.
Below, you will see how USAA’s and other insurers’ rates compare to the average annual full coverage premiums in Illinois, $3,176.60.
| GROUP | ANNUAL PREMIUM | COMPARED TO STATE AVERAGE (+/-) | COMPARED TO STATE AVERAGE (%) |
|---|---|---|---|
| Allstate | $5204.41 | $1898.93 | 0.5745 |
| American Family | $3815.31 | $509.82 | 0.1542 |
| Farmers | $4605.2 | $1299.72 | 0.3932 |
| Liberty Mutual | $2277.65 | -$1027.83 | -0.3109 |
| Progressive | $3536.65 | $231.17 | 0.0699 |
| Nationwide | $2711.81 | -$593.67 | -0.1796 |
| Geico | $2779.16 | -$526.33 | -0.1592 |
| State Farm | $2344.88 | -$960.60 | -0.2906 |
| Travelers | $2499.76 | -$805.73 | -0.2438 |
| USA | $2770.21 | -$535.28 | -0.1619 |
Though Liberty Mutual offers the cheapest rates in Illinois, USAA’s premiums are among the cheapest of the leading insurers, at 16 percent below the state average.
With lots of laws on the books, it’s impossible to remember all of them. What you don’t know could hurt you. If you’re not aware of the most important ones, you could break a law without realizing it.
To help you obey the rules, below we’ll go over some laws unique to Aurora: hands-free cell phone laws, food truck, tiny home, and parking regulations.
Keep reading to find out what’s illegal in Aurora.
Aurora doesn’t have any cell phone laws unique to the city, but the state bans handheld cell phone use for all drivers, including texting while driving. Illinois also bans other mobile devices, such as iPads.
Drivers under age 19 can’t use any devices while they drive. The law allows for some exceptions, such as an emergency situation, or if the car is pulled over or in “park” because of a roadway obstruction ahead.
The City of Aurora requires food truck or “mobile food unit” vendors to apply for a license to operate. They must also follow city-mandated safety procedures, park in certain areas, and meet other requirements. The city limits hours of operation to between 7:00 a.m. and 10:00 p.m.
Tiny homes appeal to people who want to simplify their lives. Before you abandon standard housing, you should be aware that tiny homes have specific regulations.
A tiny home is usually considered a mobile home and must follow the same laws. Aurora regulates the parking of vehicles used as a residence.
Aurora has enacted certain parking laws, which include parking not to obstruct traffic within less than 18 feet of the width of a road.
We’ve given you lots of information. Despite the data, you may have some questions about Aurora and the car insurance available there. Below, we’ll answer some frequently asked questions to round out your knowledge of all things Aurora.
So, read on to find out more.
Aurora is known as the “City of Lights” because in 1881 it was one of the first in the nation to illuminate its streets with electric lights.
As we mentioned earlier, Neighborhood Scout ranks Aurora as 43 percent safer than other cities. In our section about vehicle theft, you’ll learn more about the crime rate and the safest neighborhoods there.
According to Distance Calculator, Aurora is 35 miles from Chicago by air and 43 miles away by car.
The average annual rate for premiums in Aurora is $3,176.60. Depending on your needs and situation, you may pay more or less than average.
Illinois law requires every driver to carry a minimum amount of car insurance — bodily injury and property liability and uninsured motorist coverage.
As a “fault” state, the driver responsible for an accident must pay for injuries and property damage they caused. If your insurance doesn’t cover all of the expenses, you will need to pay the rest you owe yourself. So, it makes sense to buy more coverage than the legal minimums. Below are the state-required coverages with the minimum amounts:
| Insurance Required | Minimum Limits |
|---|---|
| Bodily Injury Liability Coverage | $25,000 per one person $50,000 per accident |
| Property Damage Liability Coverage | $20,000 minimum |
| Uninsured/Underinsured Motorist Bodily Injury | $25,000 per person $50,000 per accident |
We hope you found this guide useful and informative. If you’re ready to see how much you may pay for car insurance in Aurora, try our FREE calculator below for rates.
Auto Insurance Company Reviews / Cheap Auto Insurance